Modelling at a Microscale
Contents
The Need for a Microfluidic Platform
Microfluidics is a technology that involves the precise manipulation of fluids at the microscale. Through a set of interconnecting groves or microchannels engraved on a base chip, fluids are thoroughly mixed (Pattanayak et al., 2021). Due to its ability to handle small volumes of fluids with high precision and control, we can reduce reagent use and produce faster analysis times (Whitesides, 2006). The compact size allows precise control of physiochemical reactions of the fluid contained, with increased surface area resulting in high mass transfer and analytical throughput (Pattanayak et al., 2021).
In UBC iGEM’s 2024 project on DNA data storage, we must assemble DNA rapidly and efficiently for synthesis. Their plans consist of optimizing their thermostable-TDT (ThTdT) based nucleotide addition strategies in liquid phase (LPS), before implementing them at reduced volumes for solid phase synthesis (SPS). Given the high cost of reagents, the technical decision to implement a factorial design of experiments, and the high environmental impact of biohazardous plastic waste in such experiments - UBC iGEM’s wet lab, dry lab and human practice sub teams collectively decided to utilize microfluidic chips from the get-go.
Sustainable Biomanufacturing
Through designing a multitude of microfluidic chips, we hope to facilitate the precise delivery and mixing of nucleotides in controlled conditions (Battat et al., 2022). This allows the synthesis of long strands of DNA on a platform supportive of high-throughput synthesis through parallel production of multiple DNA sequences, making it scalable. Concurrently, it is also a method of sustainable production, since it significantly reduces the volume of reagents required for DNA synthesis, lowering cost of production, minimizing environmental impact and allowing for precise implementation of optimized reaction conditions, potentially improving the efficiency and yield of DNA synthesis processes.
Our microfluidic platform not only addresses the urgent need for more sustainable DNA synthesis but also reduces resource consumption and environmental impact at every step. By drastically minimizing the volume of reagents used, this platform lowers the carbon footprint and biohazardous waste typically associated with large-scale DNA production. Additionally, the scalability and precision of our system ensure that high-throughput synthesis can be achieved with minimal energy and material input, positioning it as a more sustainable alternative to traditional liquid-phase methods. This alignment with both sustainability goals and efficient biomanufacturing practices is a guiding principle for our hardware projects, and something we actively considered during each stage of our DBTL cycle.
This would be an ideal resource for professional North American engineers and judges who are familiar with US/Canadian engineering jargon & practices.
For the broader iGEM community, we have designed this wiki page to cover the same content, but use layman language, be easier to follow, and provided video tutorials/infographics on how to replicate our work. It is our opinion the wiki would be a better resource if teams are re-attempting our project.
Build Process and Design Cycle
Our microfluidic platform development followed a systematic and iterative design-build-test-learn (DBTL) cycle, aimed at creating an efficient, scalable, and sustainable solution for DNA synthesis. It consisted of 5 stages, which made up the bulk of our engineering cycle for this sub-project.
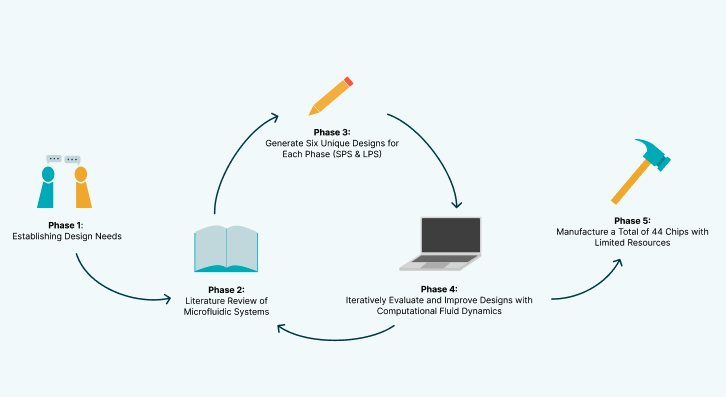
Phase 1: Establishing Design Needs
To begin our design process, we had an extensive conversation as a team about liquid phase synthesis. Specifically, we conversed with the wet lab team and microfluidic iHP contact, Antonio Wong, about the enzymatic synthesis process, reagents, and stability issues with our chosen wet lab protocols.

Given these high-level constraints, our team decided that a custom Passive micromixer would be the best way to proceed.
Phase 2: Literature Review of Microfluidic Systems
Some Technical Information on Micromixers
Micromixers can be classified into Passive and Active. Their properties have been summarized below:
Given the context of iGEM’s timeline, and taking into account our team’s budget and capabilities, we chose to pursue multiple passive micromixer designs through DBTL cycles and evaluate their performance, rather than spend all our resources on one active mixer design.
Key Findings from our Literature Review
Although the team completed an extensive literature review of passive micromixers, Wang et al. (2023)’s overview was deemed the most current and comprehensive, and heavily influenced our design process.
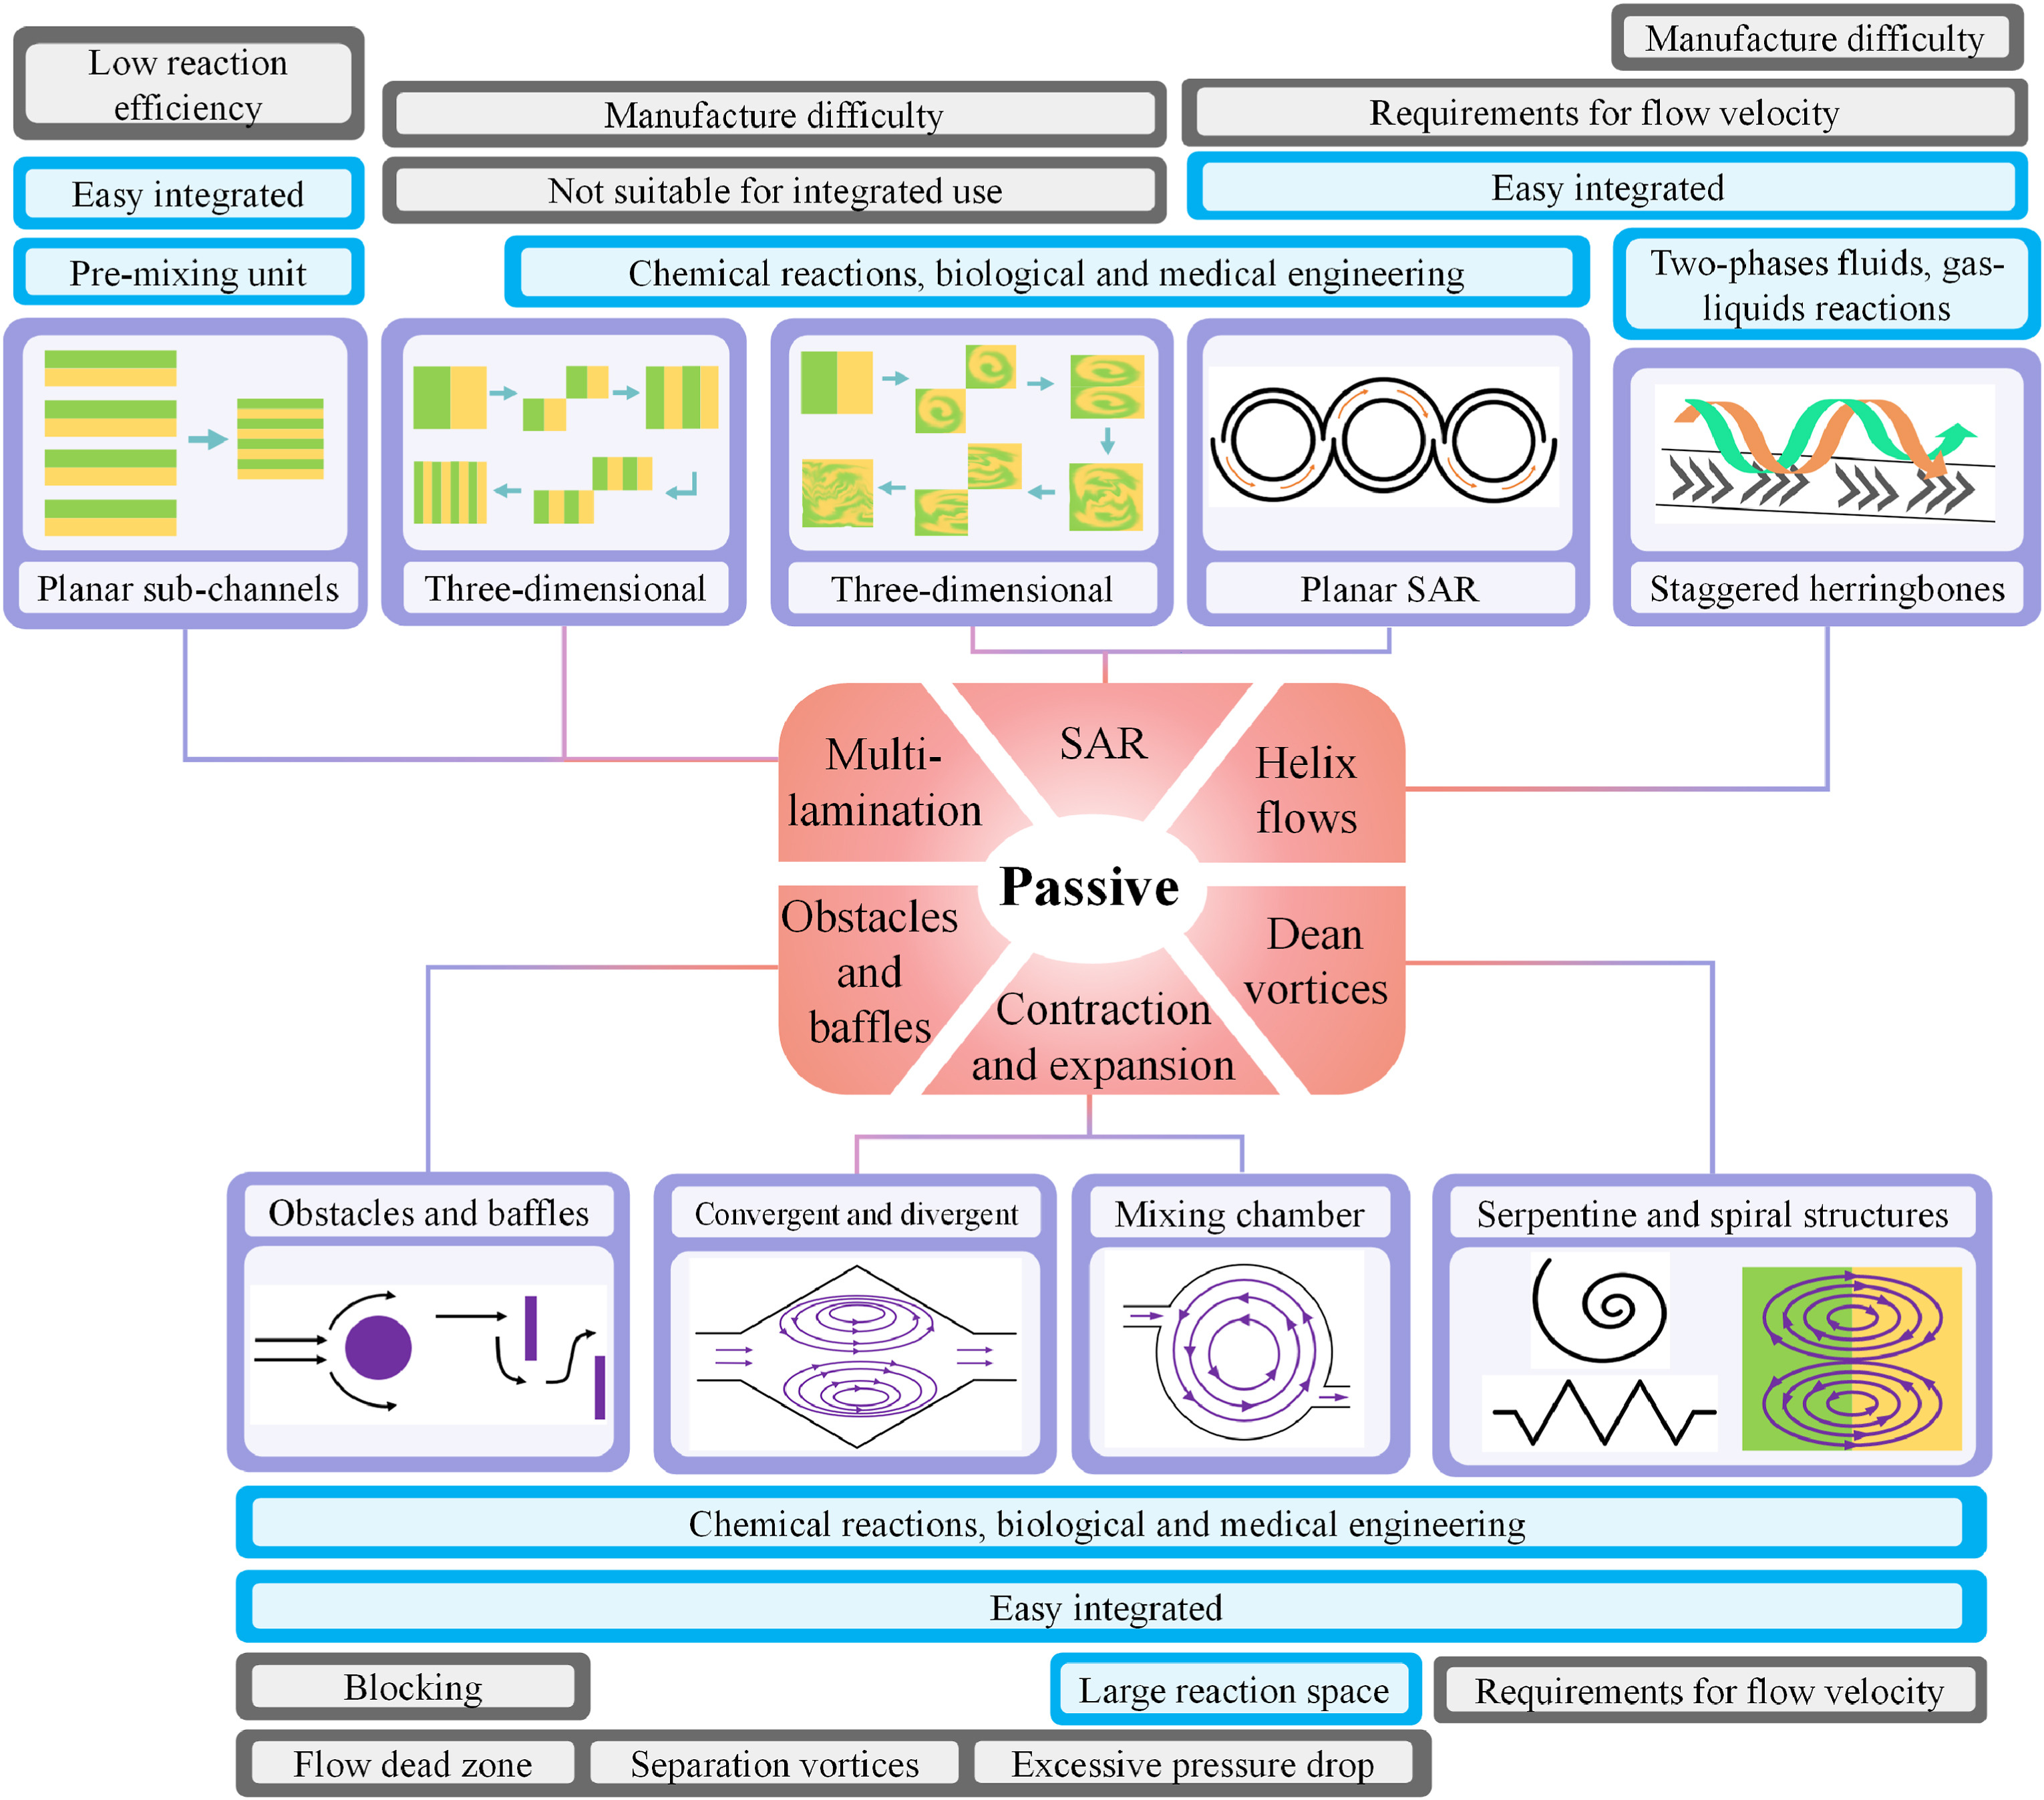
In this paper, passive micromixers were classified into 6 broad categories, each operating on a unique principle. These were:
Multi Lamination Effects
Multi Lamination is a principle that relies on splitting the fluid stream into multiple smaller streams which are then recombined, increasing the interfacial area and promoting diffusion. This method is particularly effective in laminar flow conditions where molecular diffusion is the primary mixing mechanism.
Splitting and Recombining Structures (SAR)
Splitting and recombining structures (SAR) based designs mix fluids by dividing the main inlet stream into two or more subchannels and then recombining them. This process increases the interfacial area between different fluid streams (by causing the interface between streams to become distorted), promoting chaotic advection rather than relying solely on molecular diffusion.
During our research, we realized SAR micromixers are simple to construct, cost-effective, and very effective at inducing chaotic mixing. This makes them ideal for other iGEM teams hoping to incorporate microfluidic mixing into their projects.
Baffles and Obstacles
Baffles and obstacles are used in microfluidic devices to enhance mixing by changing the flow direction and producing transverse flows. Changes in flow direction cause the fluid to fold and stretch continuously, while the transverse flows create separation vortices and flow dead zones that inhibit substance transport.
While these were very effective at mixing laminar flow, due to the subtractive nature of our manufacturing process, we weren’t sure we would be able to implement protruding obstacles in our channels.
Contraction and Expansion Effects (CAE)
This mixing strategy utilizes variations in channel cross-sections to enhance fluid mixing through the generation of vortices and flow velocity changes. It leverages reverse pressure gradients that form when fluid flows from a narrow channel into a wider one, creating expansion vortices. These vortices disrupt the flow and promote chaotic advection, creating eddy currents that increase the mixing of fluids.
These are also very easy to fabricate with laser ablation, and can be efficient micromixers. However, one potential drawback is the formation of flow dead zones, since expansion vortices can be separated from the main stream. This can be mitigated by ensuring a high enough fluid velocity within the channels to maintain flow in all regions.
Helix Flows
These mixers utilize a helical or spiral channel design to enhance mixing through secondary flow generation, which is crucial in low Reynolds number regimes where turbulent mixing is not feasible. The helical structure induces rotational flow components, increasing the interaction between fluid layers and promoting efficient mixing within a compact device footprint. This design is particularly effective in achieving rapid and thorough mixing, making it ideal for various lab-on-a-chip applications.
While having many of the benefits of CAE designs, they lack the potential drawback of dead flow zones, making it very attractive with our team.
Dean Vortices
Dean vortices are pairs of counter rotating vortices generated in curved microchannels due to the interaction between centrifugal forces and viscous forces. They are one of the most effective ways to mix fluids, typically induced by spiral or serpentine microchannels. The working principle is that the smaller the radius, the stronger the centrifugal forces, which results in better mixing. When fluids flow in a curved microchannel, central fluids flow faster than the peripheral fluids, causing the outside fluids to be pushed to the top and bottom, generating counter-rotating vortices. These structures have no risk of flow dead zones and are easy to manufacture.
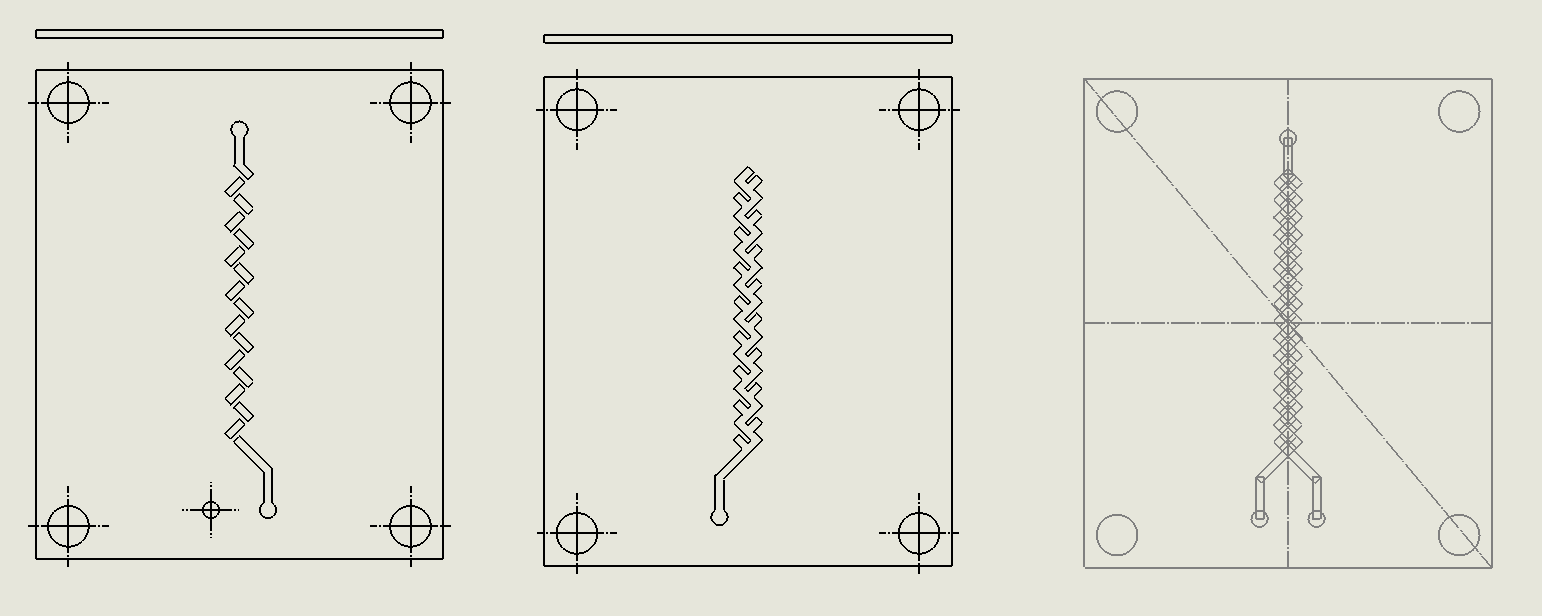
Phase 3: Generating Six Unique Designs for Each Phase (SPS & LPS), Each Employing a Different Mixing Principle
Phase 4: Iteratively Evaluating and Improving Designs Using Computational Fluid Dynamics
Once we generated our chips, our next step was to iteratively improve our chips through continuous testing on SolidWorks. Through SolidWorks Fluid Simulation tools, we can undergo Computational Fluid Dynamics (CFD) testing on our microfluidic chip designs.
CFD is the science of using computers to predict liquid and gas flows based on the governing equations of conservation of mass, momentum, and energy (Ansys, n.d.). The fluid flow domain is represented by a CAD model, a mesh is then applied to dissect the domain into well-defined cells.
Finally, the discretized version of the governing fluid equations is solved by the computer within each cell; this process is then repeated incrementally. The parameters of temperature, input liquid, mass flow rates, and mesh density greatly influence the simulation results. To accurately model our in-lab conditions, a temperature of 37℃ (310.15 K), a mesh density of 4, and a mass flow rate of 1 ml / min were chosen as parameter conditions.
Detailed description of our simulation process
For a detailed description of our simulation process, please refer to this page: 📈Notes on CFD simulation
Since this process can be hard to explain using a traditional protocol, our team opted to produce a tutorial video to help other iGEM teams learn more about our implementation of CFD!
Phase 5: Manufacturing a Total of 44 Chips With Limited Resources
Given a good understanding of our chips and our designs, we now had to sort out the logistics of manufacturing a large number of these chips, without exceeding our budget or manufacturing capabilities as a small undergraduate team. To do so, we began by consulting Dr. Albert Folch from the University of Washington, who helped us understand the challenges of creating microfluidic chips, and how we can bypass them.
Apart from leading a research lab at UBC, Dr. Folch also teaches multiple undergraduate courses at UW where students get to design and prototype their own chips. Based on his experiences, he suggested:
Sourcing Materials and Accompanying Costs
| Part | Description | Source | Cost |
|---|---|---|---|
| PMMA Acrylic Sheets - Set of 20 | Used as a medium for our SPS and LPS chips | Langaelex Acrylic Sheets - 20 Pack of 8x10” 0.043” Thick Clear Extruded Plexiglass for Picture Frame Glass Replacement, Projects Display & Painting - Laser Cut for Smooth Edges : Amazon.ca: Home | 30CAD |
| Adhesive Transfer Kit | Used to create resin bonds between microfluidic layers | https://www.amazon.ca/dp/B007Y7DFUE?ref=ppx_yo2ov_dt_b_fed_asin_title | 15CAD |
| PLA Filament | Used to print the guide rods on which the chips were assembled | https://www.amazon.ca/dp/B07ZPT32M8?ref=ppx_yo2ov_dt_b_fed_asin_title | 24CAD |
And that was it! Thanks to Dr. Folch’s guidance, this is all we had to buy to get started on the manufacturing process.
Manufacturing the Chips
Given we had to make 44 chips, it was imperative to establish an efficient, scalable and sustainable manufacturing process. To achieve this, we utilized laser ablation to produce through cut representing channels on the microfluidic chips. This process allowed us to rapidly fabricate each layer of our microfluidic chips with high precision.
Additionally, the 3M 9495MP double-sided adhesive was successful in ensuring structural integrity while minimizing assembly complexity, with a minimal need for troubleshooting.
A general outline of our manufacturing process is presented below:
- Peel off Wax paper from one side of the PMMA sheets, clean the surface with isopropanol, and apply the 3M transfer adhesive onto one side.
- Place the PMMA sheets face down in a Epilog laser cutter.
- Generate .DXF files from SolidWorks, which can be used by the Epilog’s software.
- Monitor the laser cutter to ensure the cut proceeds without random error.
- Remove chips from the laser cutter, clearing any debris from the newly cut channels using a pipette tip.
- Inspect the channels under a microscope to ensure they are clear of all debris.
- Peel off the adhesive cover and wax paper from both sides of the chip, and begin stacking them on the guide rods to complete assembly. Between each stage, apply pressure using speed clamps on the channels. This ensures a strong bond.
- Continue the process until the chip has been assembled.
We recognize these instructions can be hard to follow, so our team created instructional videos for other teams to attempt our low-cost methodology!
Generating DXF Files
Assembling a Microfluidic Chip
Testing the Chips Post Completion
How to Troubleshoot Common Failures
Our Chips
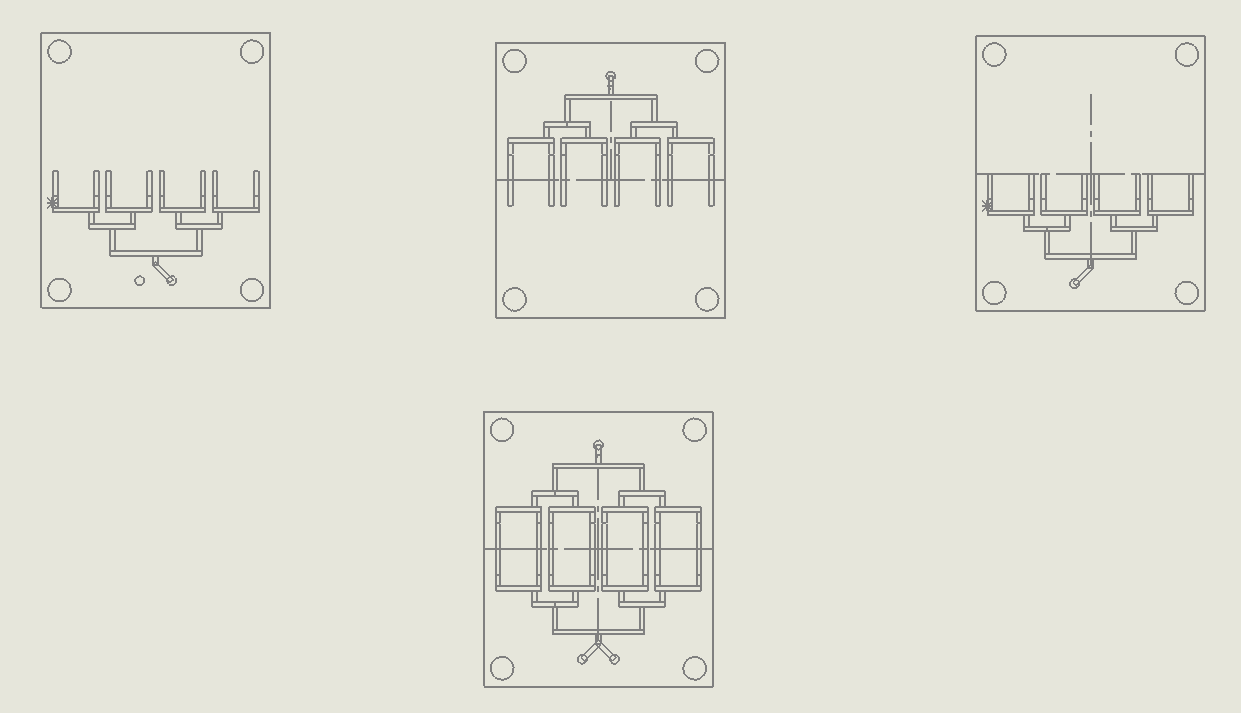
LPS
Following our design guidelines and build process, we evaluated different mixing strategies by creating 6 LPS chips with different geometries. However, due to the limitations of our laser ablation process, we were unable to create a “Baffles & Obstacles” LPS chip because almost all recent publications with this design required additive manufacturing rather than our subtractive manufacturing. Instead, we chose to explore an additional Split and Recombination design.
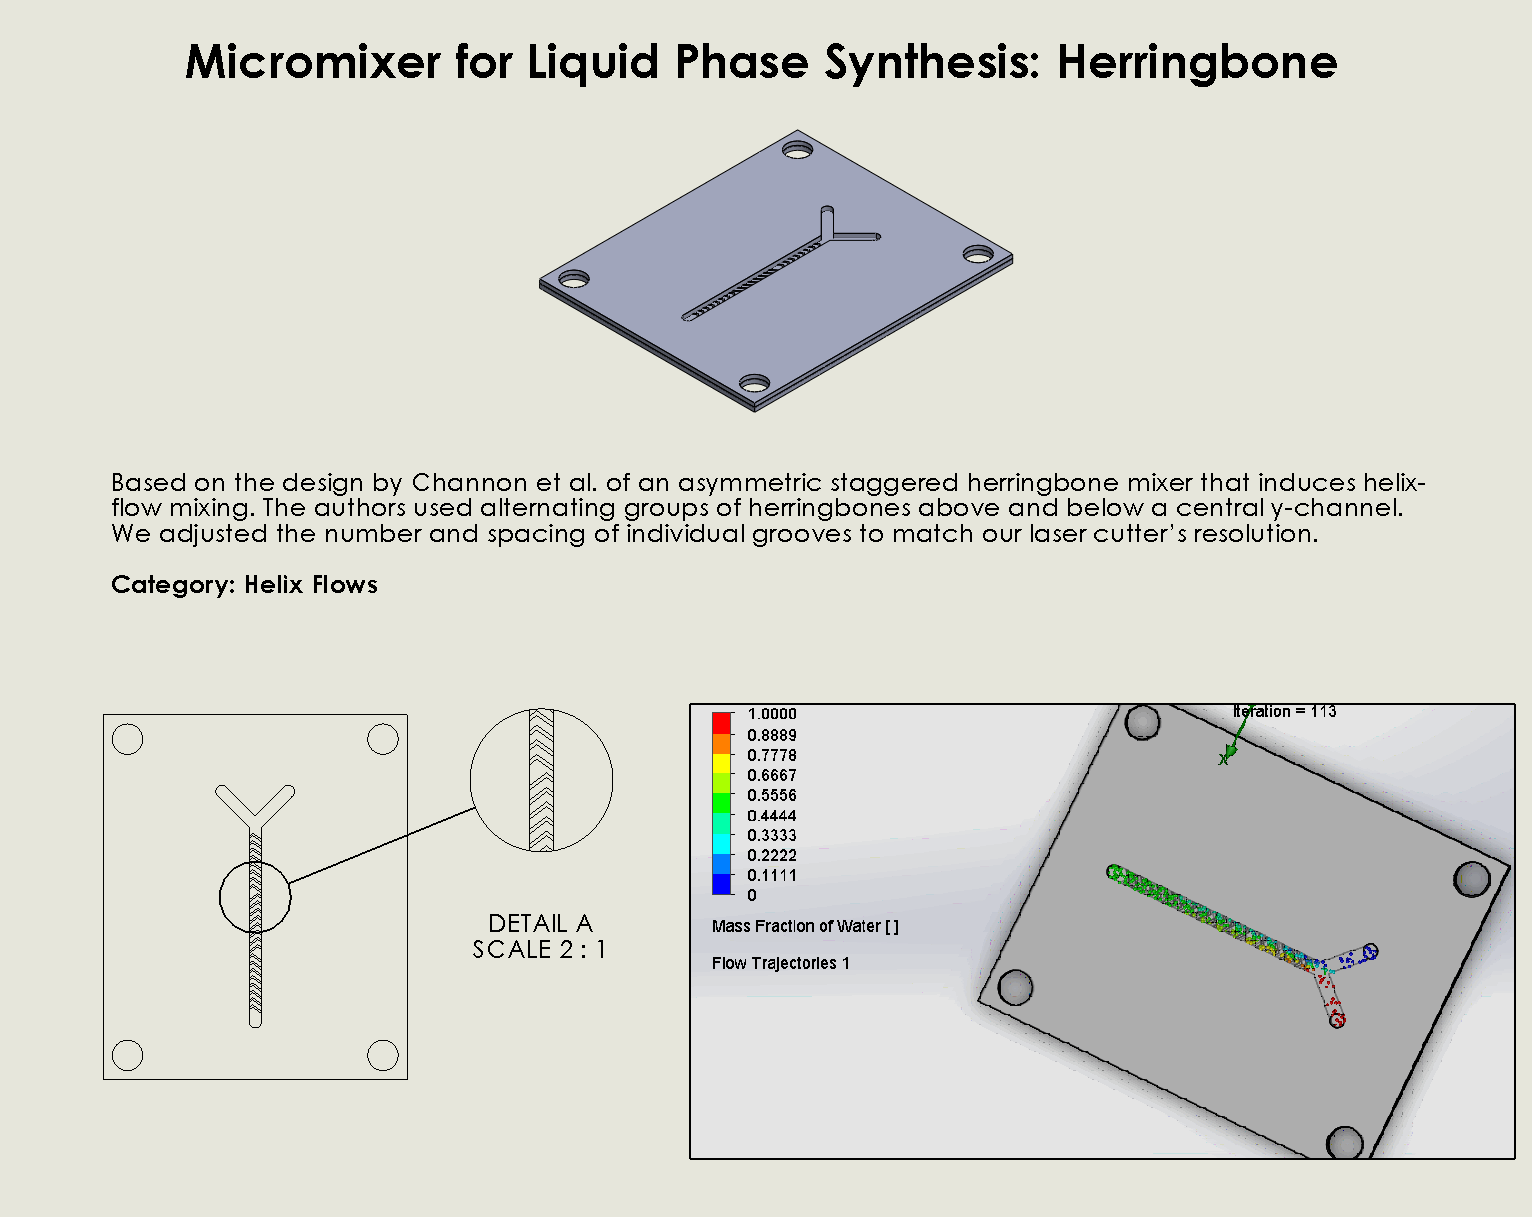
“Herringbone” Helix Flow Chip
Description:
The Herringbone Helix Flow Chip integrates two powerful passive mixing strategies—herringbone ridges and helical flow—to enhance the efficiency of fluid mixing within microchannels (Channon et al., 2021). The
herringbone ridges, patterned along the channel walls, create chaotic advection by generating transverse flows, which disrupt laminar streams and increase the interaction between fluid layers. Combined with the helical flow design, which induces secondary rotational flows, this chip ensures thorough mixing even at low Reynolds numbers. This dual-flow design makes it ideal for applications requiring precise control over reaction conditions, such as DNA synthesis.
Why it was chosen:
The Herringbone Helix Flow geometry was chosen due to its
ability to effectively mix fluids even in low-flow conditions, making it highly suitable for precise DNA synthesis where maintaining controlled conditions is critical. Its design efficiently mitigates dead zones, ensuring complete mixing within a compact footprint. Moreover, the robustness of its helical flow design makes it ideal for processes requiring high reliability and consistency, while still being energy efficient and easy to fabricate.
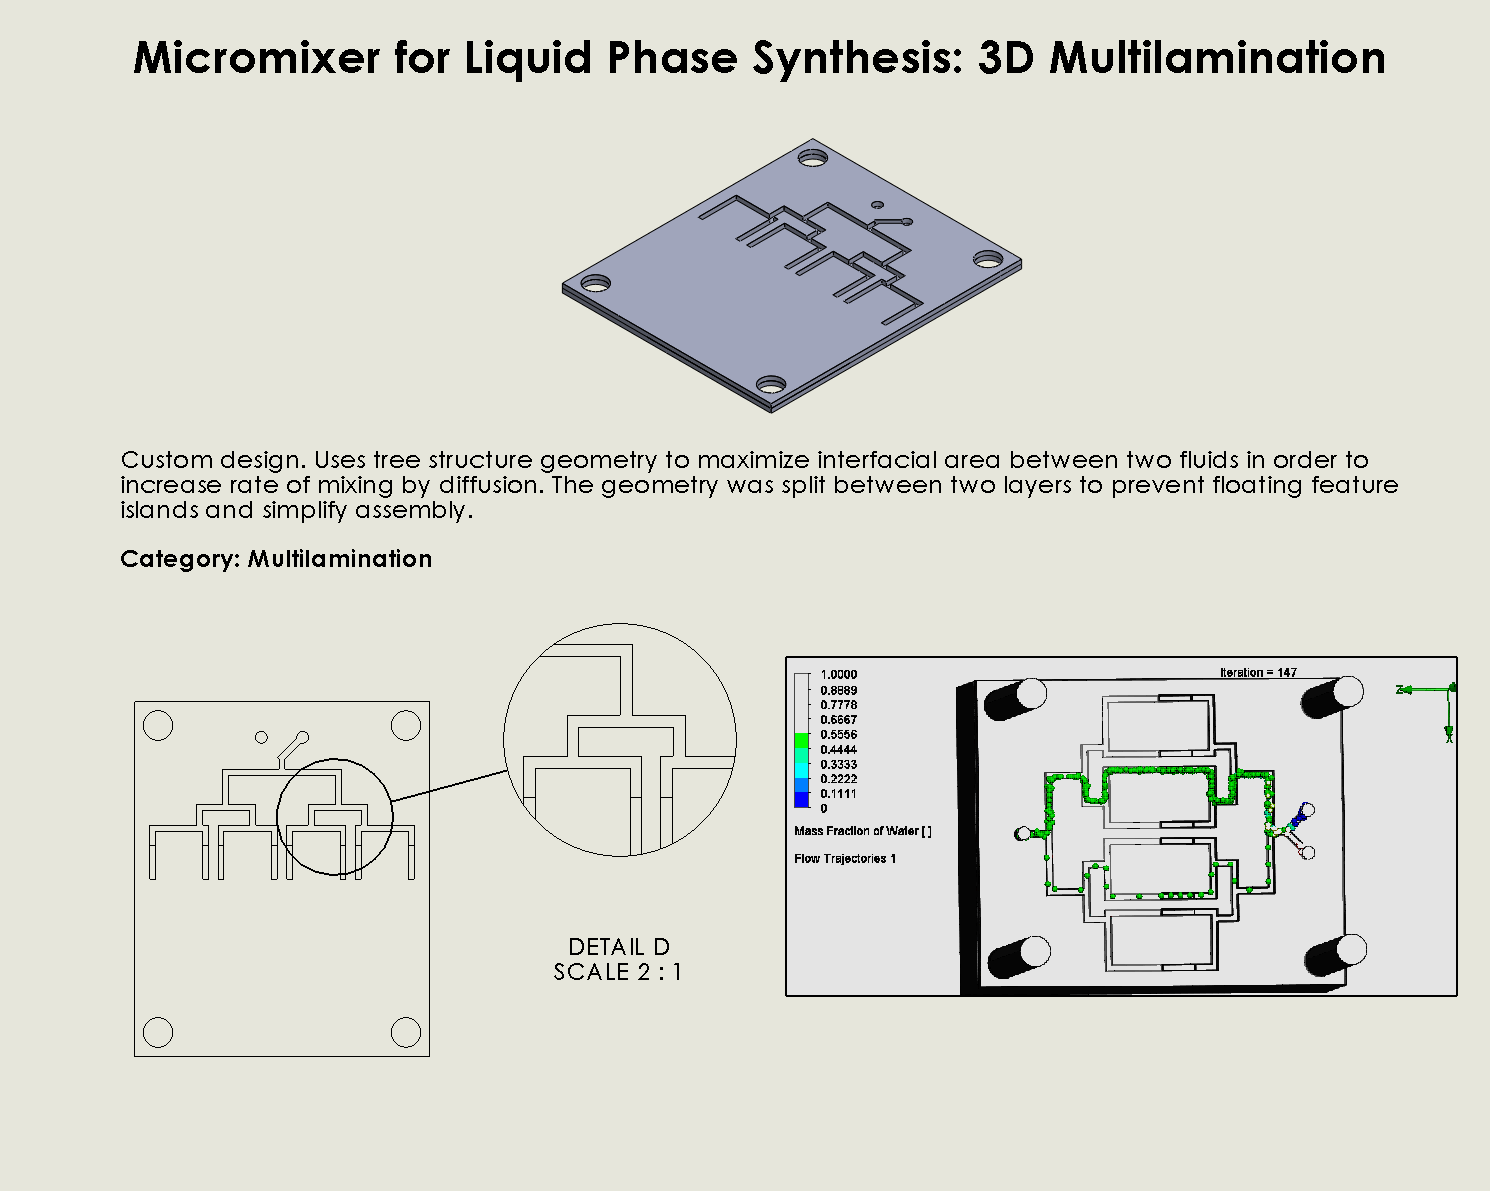
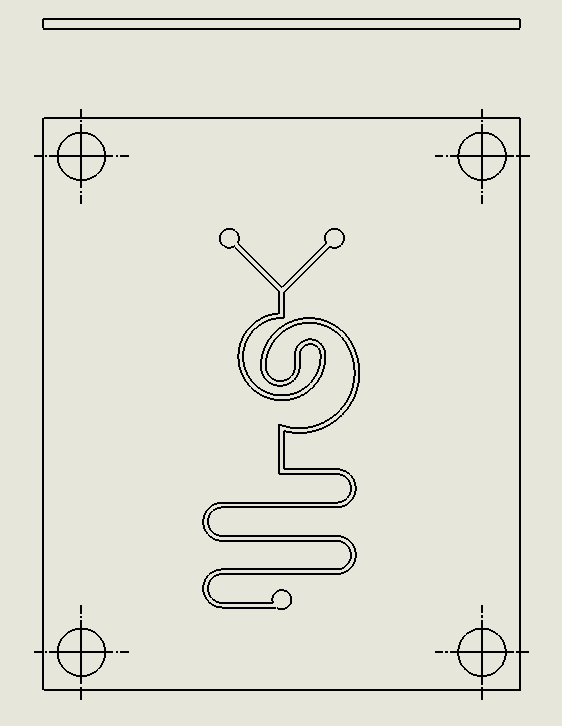
“Binary Tree” Multilamination Chip
Description:
The Multi Lamination Chip is designed to split fluid streams into multiple smaller laminar flows, increasing the interfacial surface area between different fluid layers. As the fluid passes through the microchannels, these streams are recombined, promoting molecular diffusion at the interfaces (Suh & Kang, 2010). This lamination effect enhances mixing efficiency without the need for external agitation, making it ideal for processes that rely on consistent and uniform fluid distribution, such as DNA synthesis or chemical reactions in synthetic biology.
Why it was chosen:
This Multi Lamination Chip geometry was selected for its
high precision in creating uniform fluid layers, which enhances the accuracy of reagent mixing during DNA synthesis. This chip provides fine control over mixing processes without the need for complex external controls. Its straightforward design ensures rapid fabrication and easy scalability, making it an excellent choice for high-throughput applications that prioritize precision over turbulence-driven mixing.
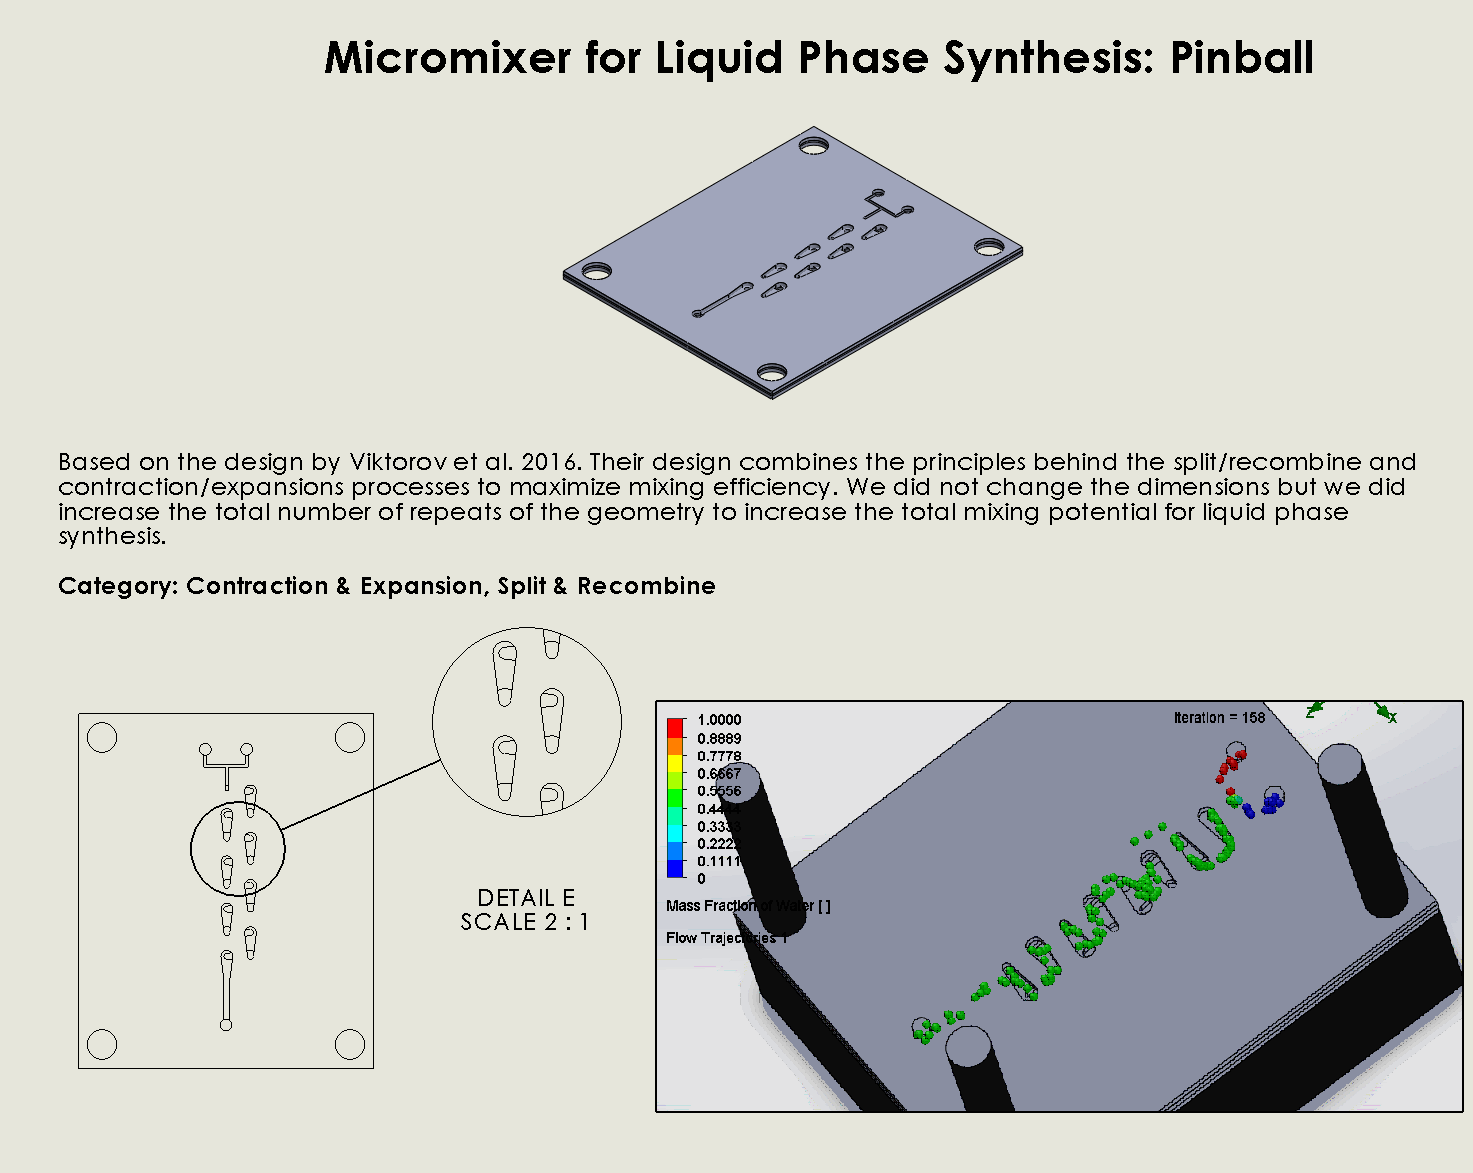
“Pinball” Contraction and Expansion Chip
Description:
The “Pinball” Contraction and Expansion Chip leverages a series of alternating narrow and wide sections along the microfluidic channel (Viktorov et al., 2016). As fluid passes through these constricted and expanded regions, vortices are generated in the expansion zones due to reverse pressure gradients. This “pinball” effect disrupts the flow and enhances chaotic advection, ensuring that fluid streams mix effectively. The geometry of the chip is carefully designed to induce vortex formation at strategic points, allowing for efficient mixing with minimal energy input.
Why it was chosen:
The “Pinball” Contraction and Expansion Chip was chosen for its
unique ability to generate vortices through simple geometric features, making it highly efficient in inducing chaotic mixing without requiring external forces. This chip offers a balance between effective mixing and minimal material use, allowing for both energy and material conservation. It’s also easily fabricated with laser ablation, which aligns with our project’s goal of using sustainable, low-cost methods for scalable biomanufacturing.
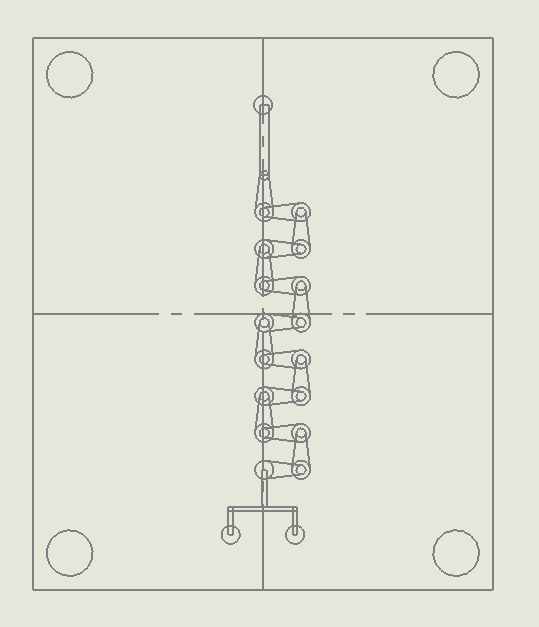
“Countered Spirals” Dean Vortices Chip
Description:
The “Countered Spirals” Dean Vortices Chip utilizes curved microchannels to induce secondary flows known as dean vortices (Hong & Yeom, 2022). When fluids pass through these curved paths, centrifugal forces act on the fluid, creating pairs of counter-rotating vortices that significantly enhance mixing. The spiral design of this chip maximizes the interaction between fluid layers, promoting efficient mixing in systems with laminar flow regimes. The geometry ensures that as the fluid flows through the alternating spiral channels, the mixing is amplified by the continuous formation of dean vortices.
Why it was chosen:
The “Countered Spirals” Dean Vortices Chip was selected for its
ability to generate strong secondary flows in curved channels, making it highly effective at mixing even at low Reynolds numbers. This chip provides a unique advantage by maintaining laminar flow while inducing sufficient turbulence to ensure uniform mixing. It is particularly well-suited for applications that require delicate handling of fluids, such as DNA synthesis, where turbulent mixing might cause shear stress. Additionally, the curved design is easily fabricated using laser ablation techniques, ensuring that it meets both the sustainability and scalability goals of the project.
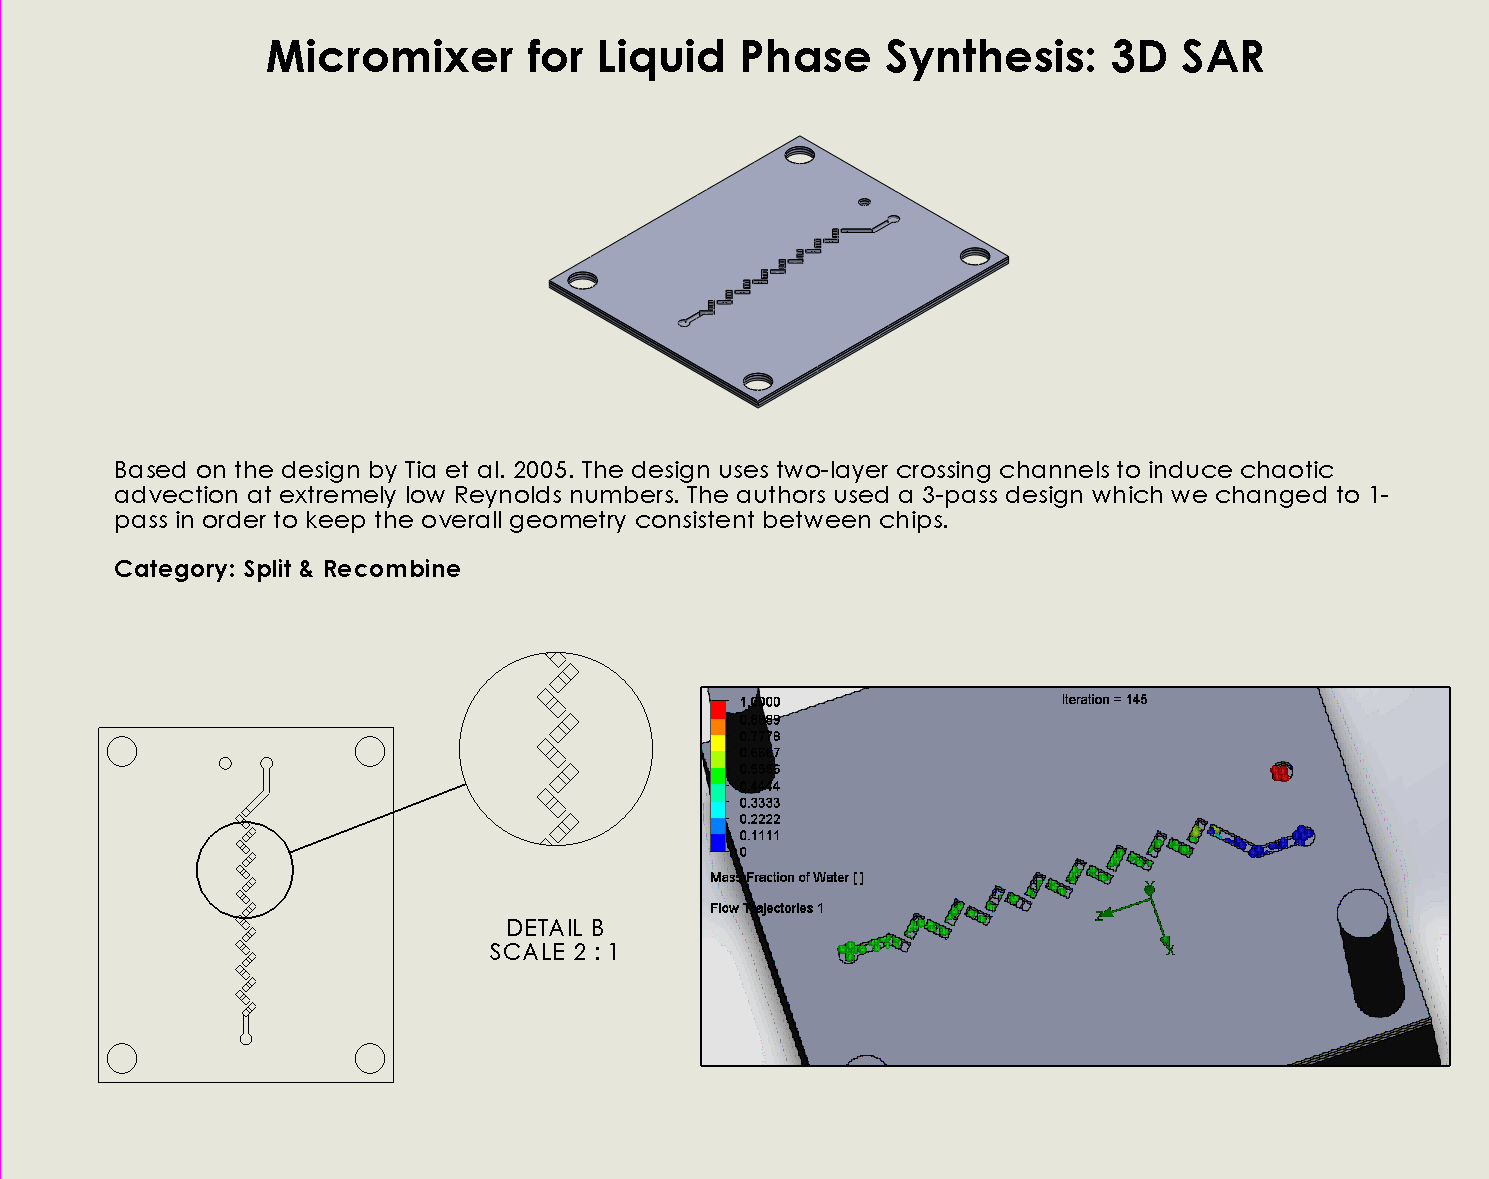
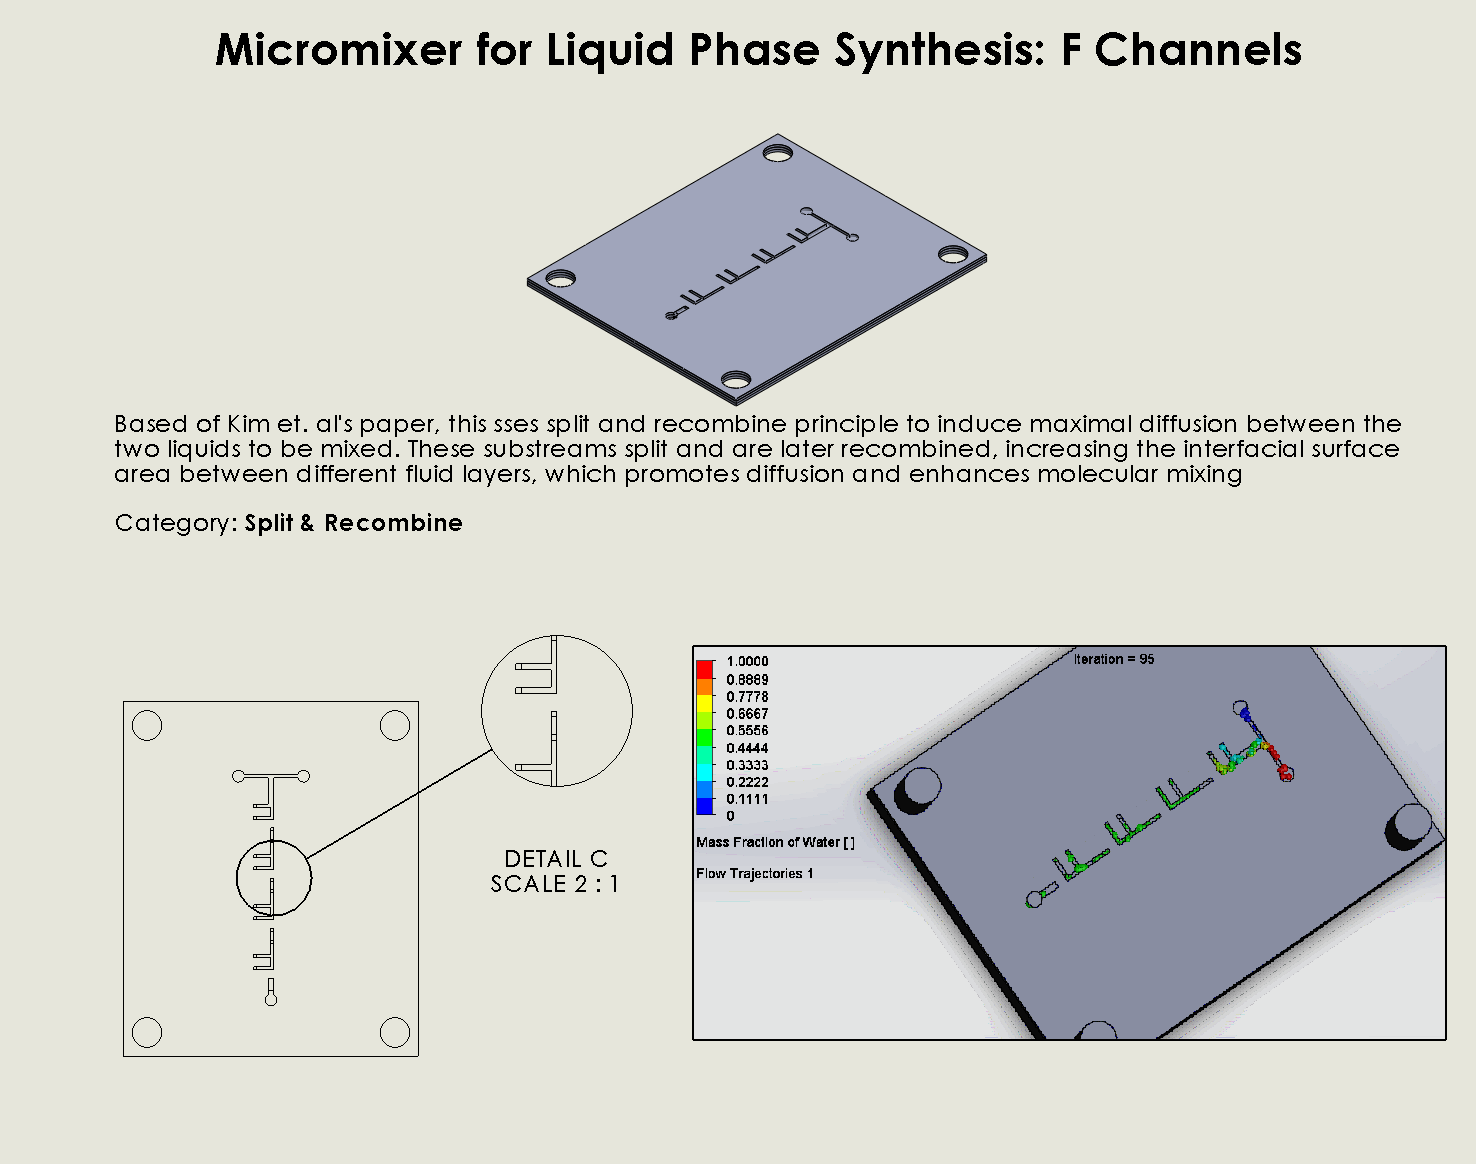
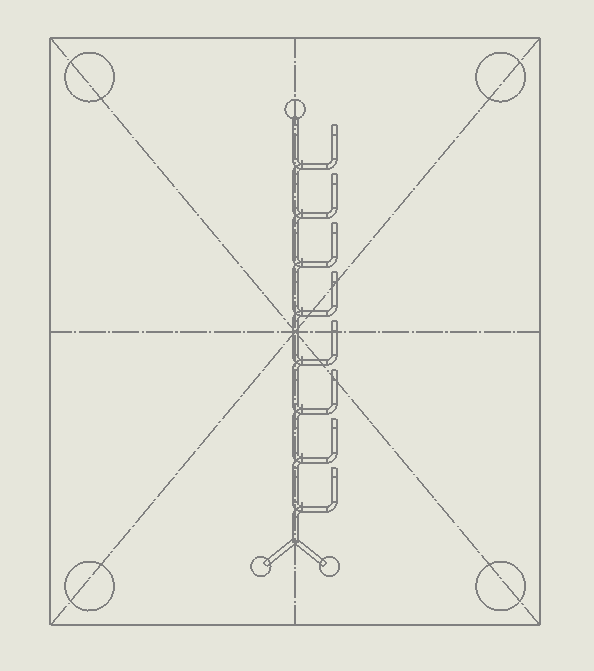
“F Channel” Split and Recombination Chip
Description:
The “F Channel” Split and Recombination Chip operates by dividing fluid streams into smaller substreams that flow through branched channels (Kim et al., 2005). These substreams are later recombined, increasing the interfacial surface area between different fluid layers, which promotes diffusion and enhances molecular mixing. The “F” shape of the channels ensures that fluids are split multiple times, generating a higher degree of interaction between the streams to promote effective mixing.
Why it was chosen:
The “F Channel” Split and Recombination Chip was chosen for its
ability to achieve thorough mixing via simple geometric manipulation, making it a robust and efficient solution for fluid mixing in DNA synthesis processes. This chip excels in applications where the goal is to maximize the interaction between fluid streams in a controlled, laminar flow environment. Its design is easy to fabricate using laser ablation, ensuring quick production, and its scalability ensures that it can handle higher-throughput operations while still minimizing reagent use, aligning with our sustainability goals.
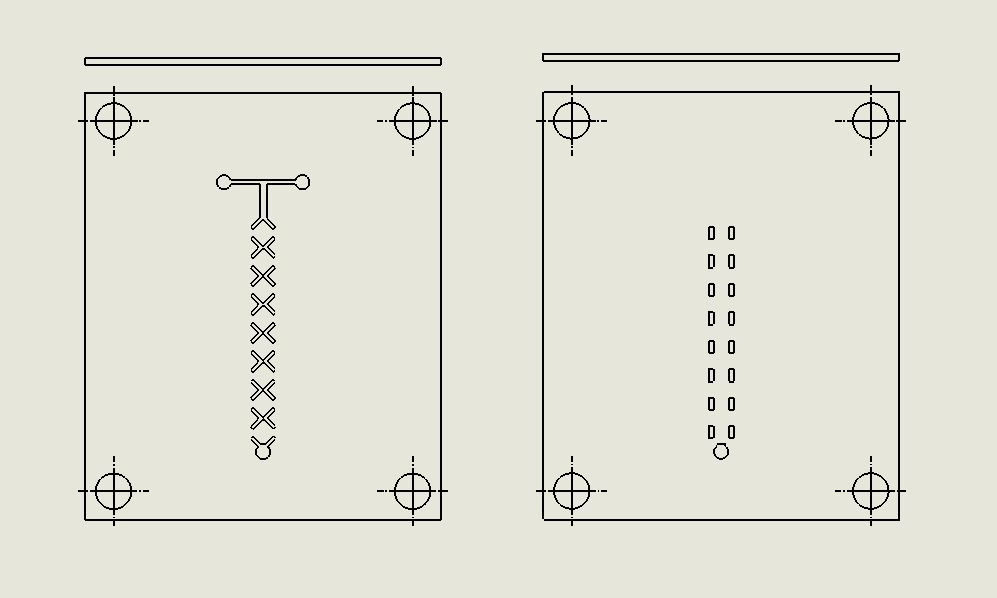
“Criss-Cross” Split and Recombination Chip
Description:
The Criss-Cross Split and Recombination Chip employs a series of alternating cross-channel segments to split the fluid flow into multiple streams, which are then recombined (Xia et al., 2005). The criss-cross pattern maximizes the interaction between streams, effectively disrupting laminar flow and enhancing the diffusion of molecules between the layers. This geometry ensures that as fluids pass through the chip, they undergo multiple splitting and merging cycles, which promotes efficient mixing through chaotic advection.
Why it was Chosen:
The Criss-Cross Split and Recombination Chip was selected for its high efficiency in achieving chaotic advection through repeated splitting and recombination. This chip is particularly effective at maintaining uniform mixing without introducing turbulent flow, making it ideal for DNA synthesis applications where precise fluid handling is critical. Its design supports high-throughput mixing while remaining simple to fabricate using laser ablation techniques, aligning with the project’s objectives of scalability, cost-efficiency, and minimal environmental impact. Additionally, the criss-cross geometry allows for highly reproducible results, making it a versatile option for a wide range of microfluidic processes.
SPS
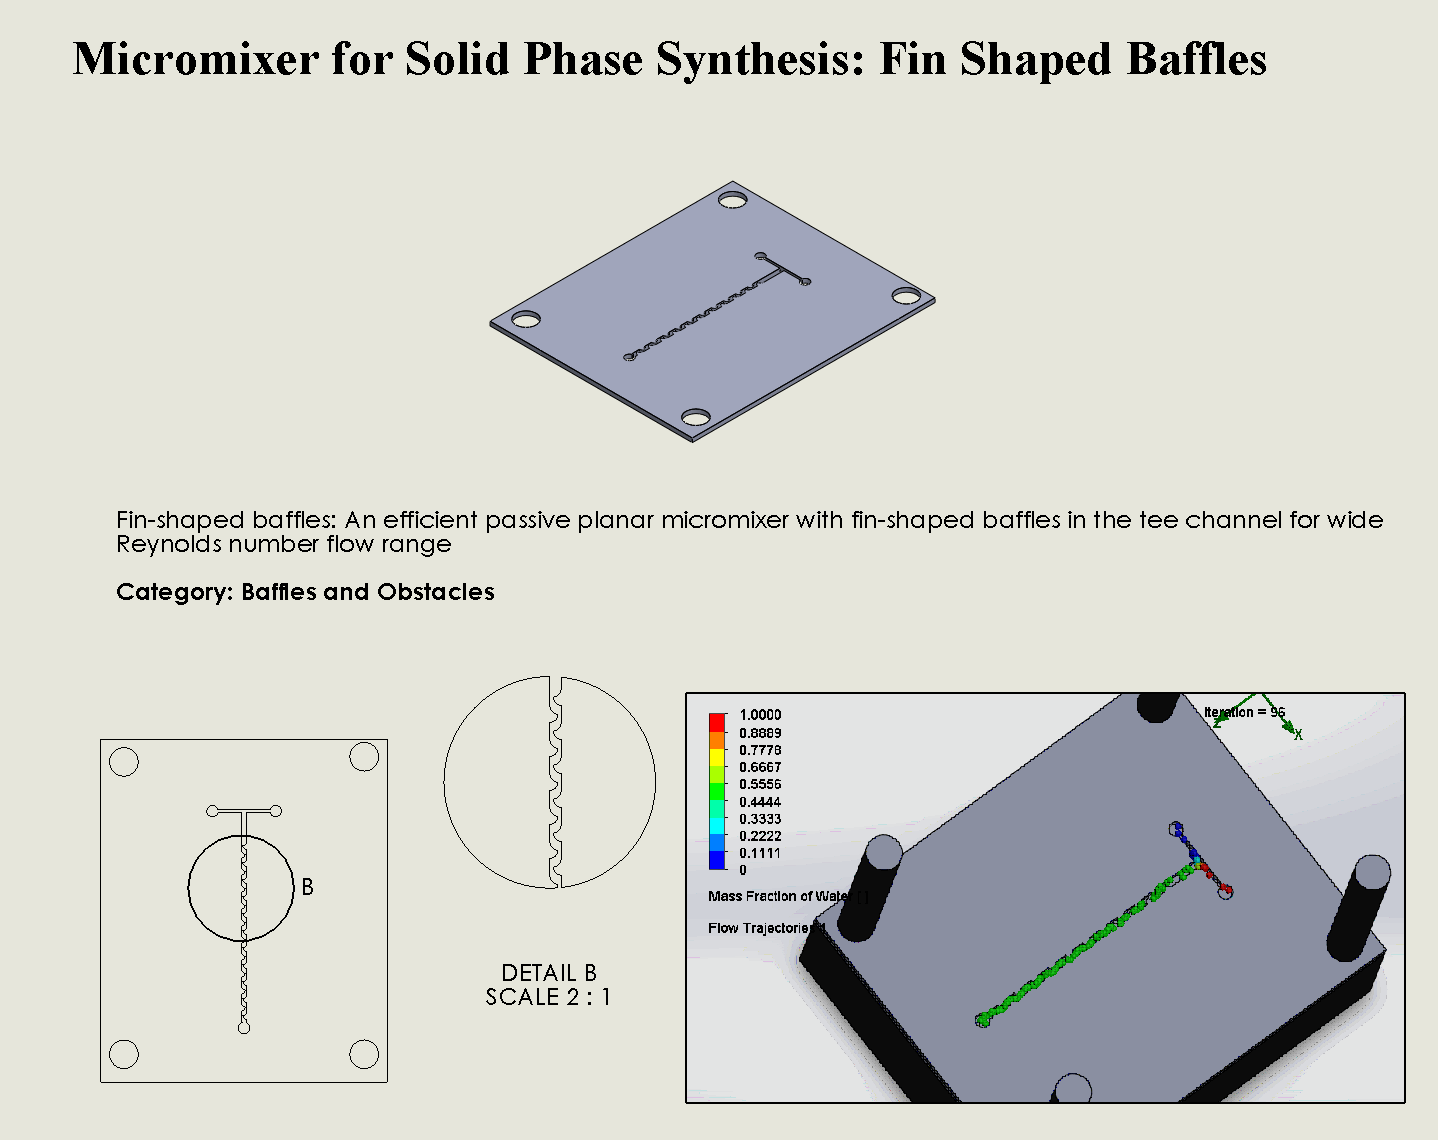
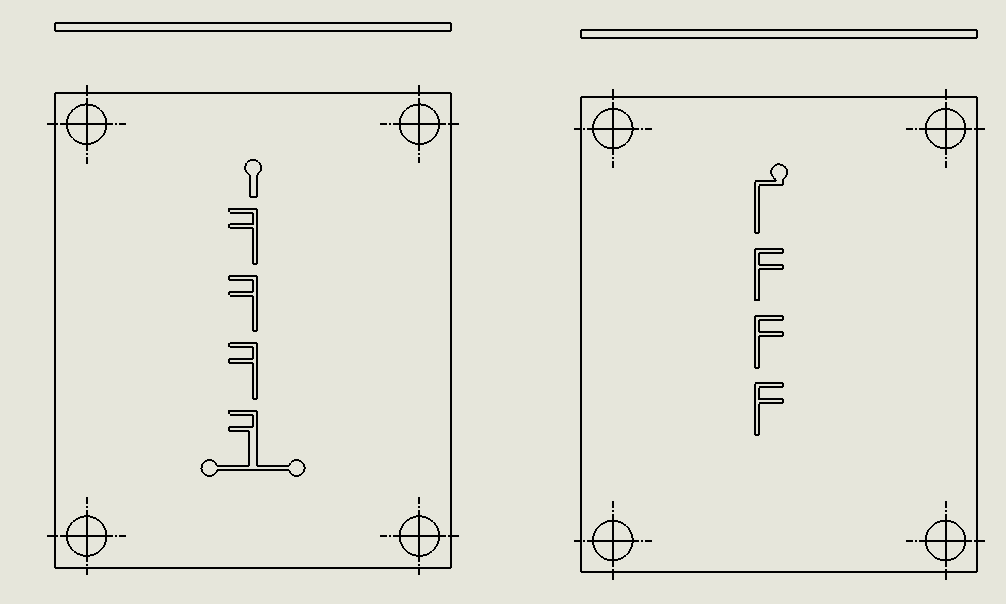
“Fin Shaped” Baffles Chip
Description:
The Fin Shaped Baffles Chip utilizes strategically placed fin-shaped obstacles within the microfluidic channel to alter the flow direction and generate transverse flows (Cortes-Quiroz et al’s, 2010). As fluids pass through the fins, the flow is continuously folded and stretched, creating vortices and enhancing chaotic advection. The unique fin geometry disrupts laminar flow in a controlled manner, ensuring that fluids mix efficiently even at low Reynolds numbers. The design minimizes dead zones and improves mixing efficiency by taking advantage of flow separation and reattachment around the fins.
Why was it chosen:
The Fin Shaped Baffles Chip was selected for its ability to induce chaotic mixing through simple yet effective geometric features, making it highly reliable for situations where precise and consistent fluid mixing is required. The fin-shaped baffles significantly enhance transverse flow without introducing excessive turbulence, ensuring that delicate reactants, such as those used in DNA synthesis, are mixed uniformly. This design is easily manufactured using laser ablation, making it both cost-effective and scalable. The chip’s ability to maintain high mixing efficiency while minimizing energy and reagent use aligns perfectly with the sustainability and scalability goals of our project.
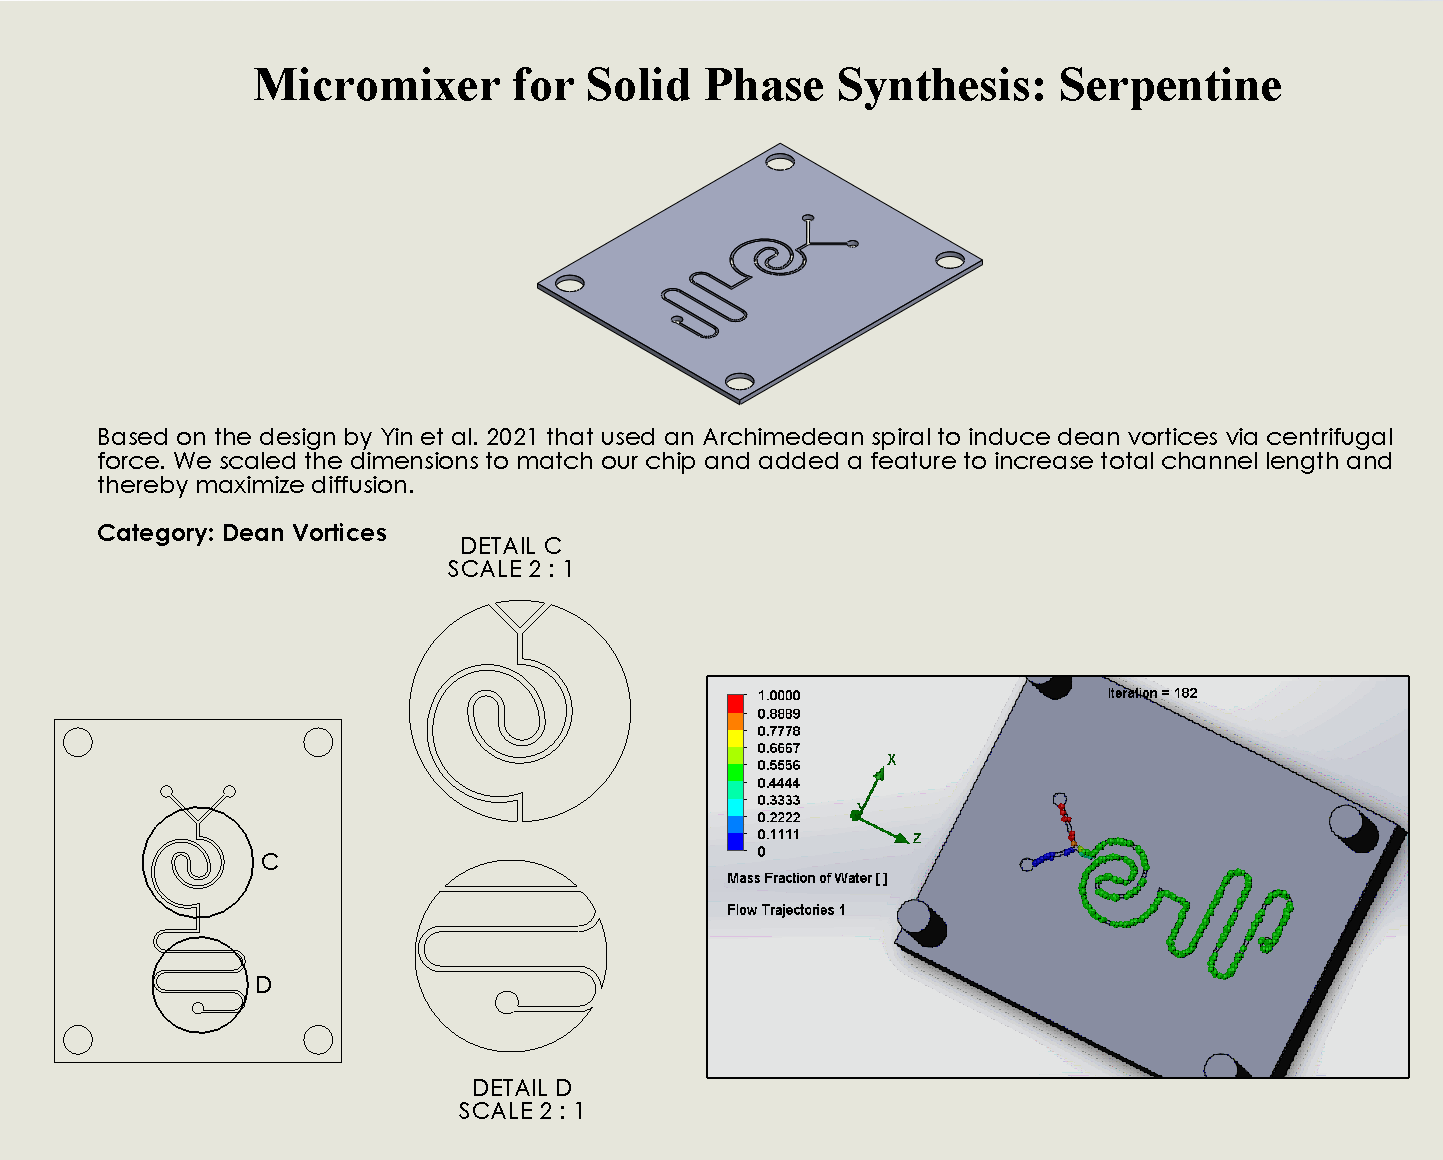
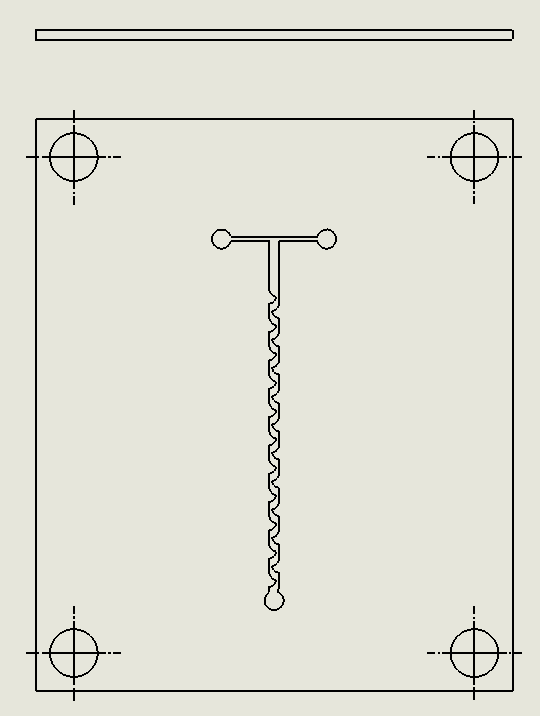
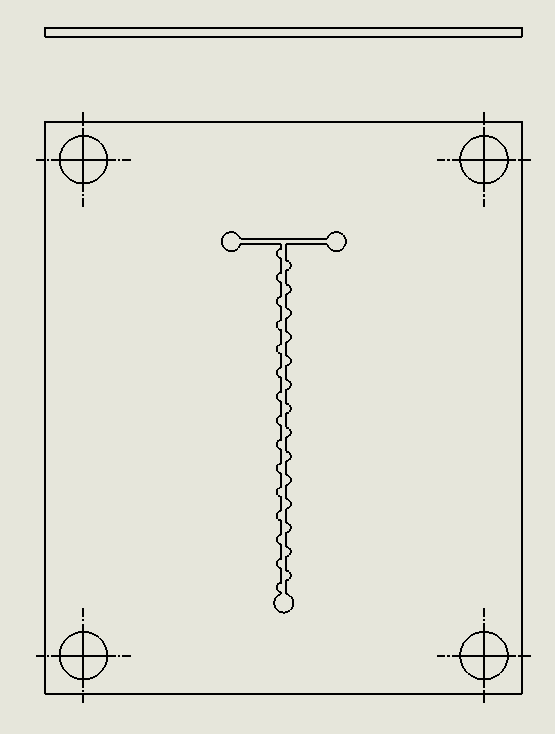
“Serpentine” Dean Vortices Chip
Description:
The Serpentine Dean Vortices Chip features a serpentine microchannel layout that forces fluid to follow curved paths, generating dean vortices through the interaction of centrifugal and viscous forces (Yin et al., 2021). As the fluid flows through the alternating turns of the serpentine design, secondary vortices are formed, increasing mixing efficiency by promoting cross-stream diffusion. The continuous curves within the chip generate strong vortices, ensuring that even laminar flows experience effective mixing.
Why was it chosen:
The Serpentine Dean Vortices Chip was chosen for its exceptional ability to create strong Dean vortices within a compact, curved design, making it highly effective for applications that require efficient mixing in confined spaces. The serpentine geometry allows for increased mixing without requiring high fluid velocities, making it energy efficient and suitable for delicate biological processes, such as DNA synthesis. Its fabrication is straightforward using laser ablation, and its design minimizes reagent use, aligning with the project’s sustainability goals. The chip’s ability to consistently generate vortices ensures reliable mixing performance, making it a versatile tool for scalable biomanufacturing.
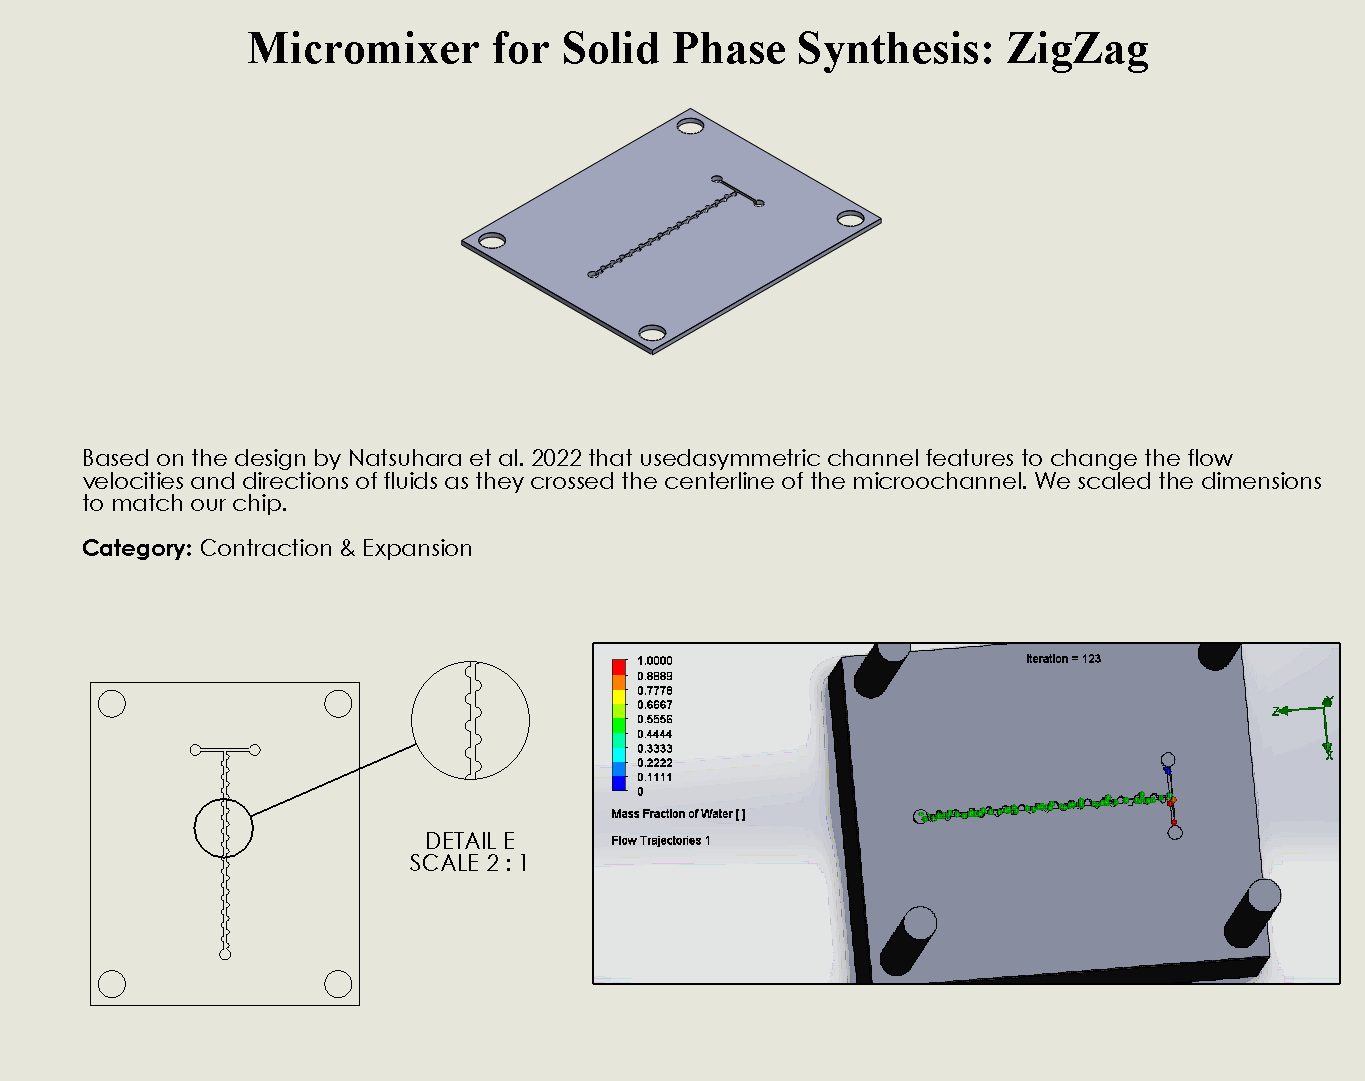
“ZigZag” Contraction and Expansion Chip
Description: The ZigZag Contraction and Expansion Chip employs a zigzag microchannel design that alternates between narrow and wide sections. This repeated contraction and expansion generate significant flow disturbances, creating vortices and enhancing chaotic advection. As the fluid passes through the narrow sections, it accelerates, and upon reaching the expanded sections, it decelerates, promoting mixing through turbulence. The zigzag geometry increases the interaction between fluid layers and prevents the formation of dead zones, leading to more efficient mixing even at low Reynolds numbers. (Natsuhara et al.’s, 2022).
Why Was It Chosen?
The ZigZag Contraction and Expansion Chip was selected for its ability to generate consistent and efficient mixing through simple geometric manipulation. The contraction-expansion pattern in the zigzag layout allows for effective mixing without requiring external energy sources, making it a sustainable solution for fluid mixing in DNA synthesis applications. Its ease of fabrication using laser ablation techniques ensures that it can be reproduced at a low cost while maintaining high performance. Additionally, the chip’s design promotes scalability, as its predictable and controlled mixing behavior can be easily adapted for larger-scale biomanufacturing processes.
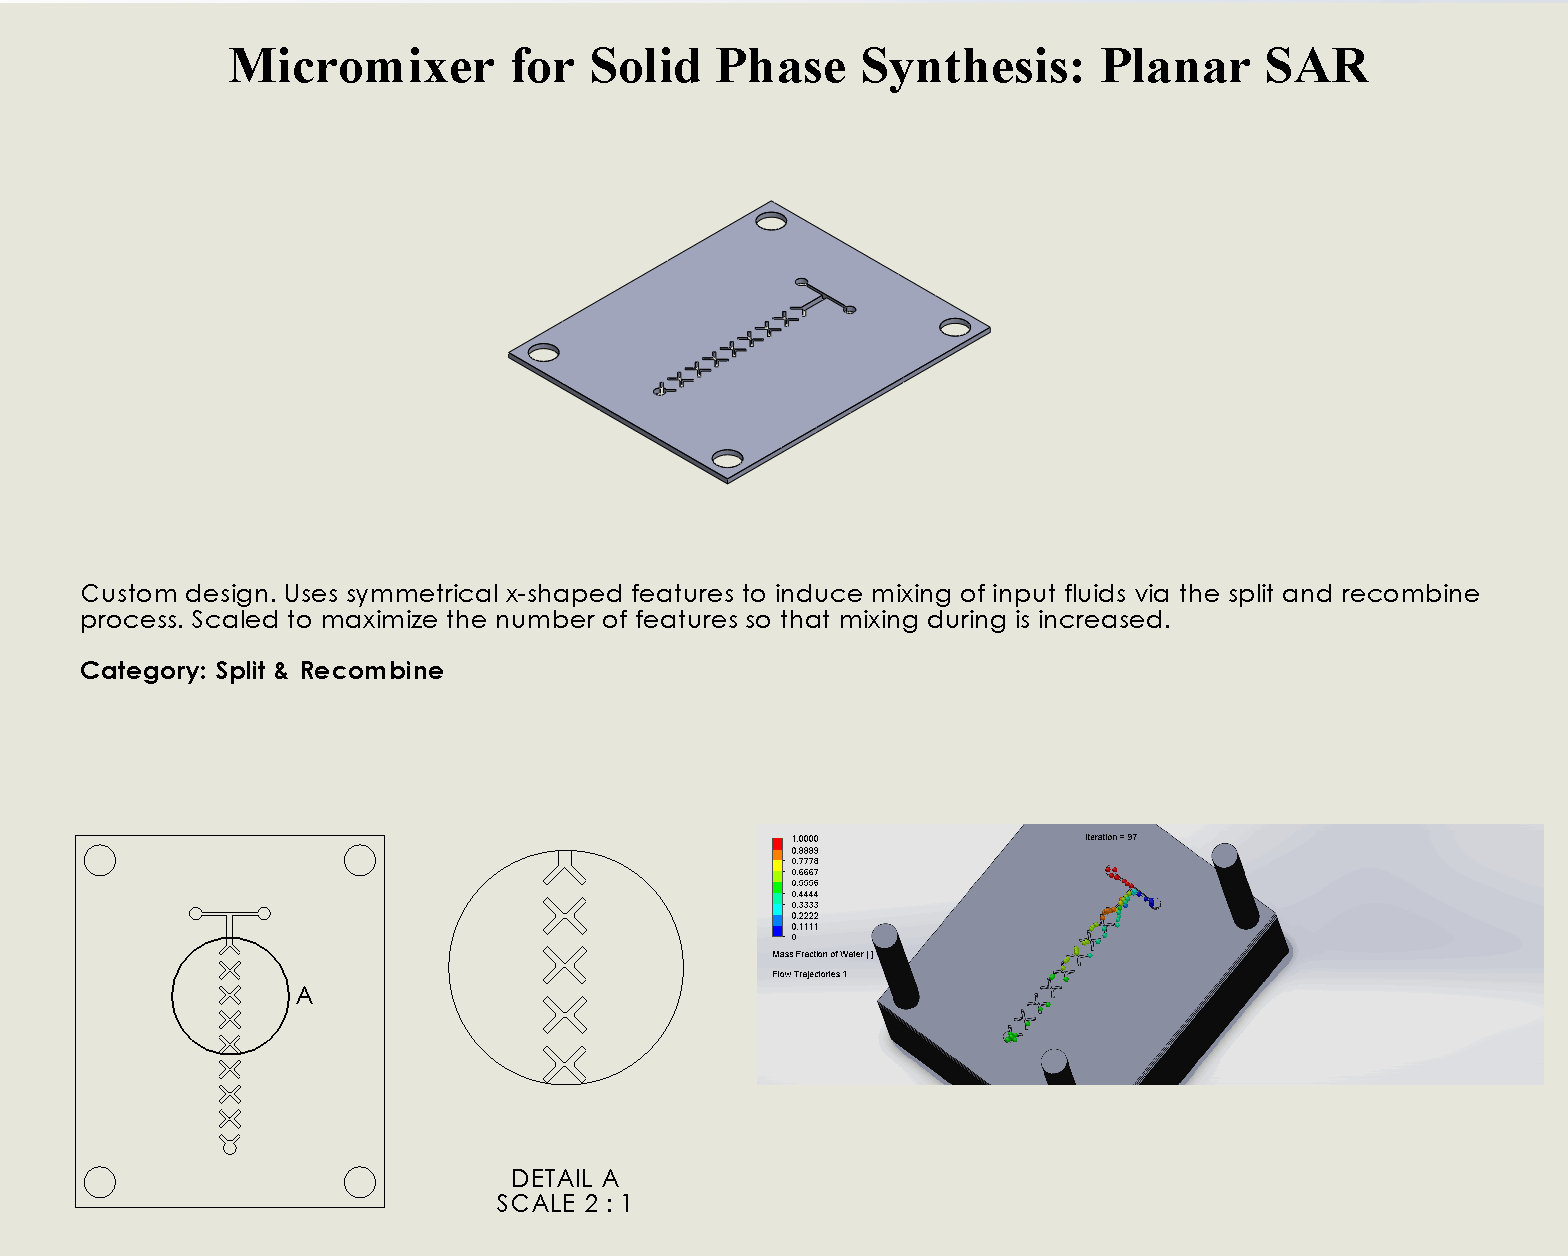
“Planar” Split and Recombination Chip
Description:
The Planar Split and Recombination Chip uses a series of planar microchannels to split the fluid into smaller streams, which are then recombined downstream (Husain et al., 2018). The planar configuration allows for efficient manipulation of the fluid in a two-dimensional space, promoting increased interaction between the split streams. This layout generates chaotic advection through the constant splitting and recombining of fluid streams, enhancing diffusion and mixing efficiency without requiring complex geometries or external energy inputs.
Why Was It Chosen?
The Planar Split and Recombination Chip was chosen for its ability to achieve effective mixing within a simple, planar structure, making it ideal for applications where spatial constraints are a consideration. Its planar design minimizes the complexity of fabrication while still promoting strong mixing through passive means. The chip is straightforward to manufacture using laser ablation techniques, which aligns with our project’s goal of low-cost, scalable production. Additionally, its simplicity reduces the potential for fabrication errors, ensuring reliable performance in DNA synthesis and other biomanufacturing processes. The planar structure also allows for easy integration into multi-layer microfluidic systems, making it a versatile and efficient solution.
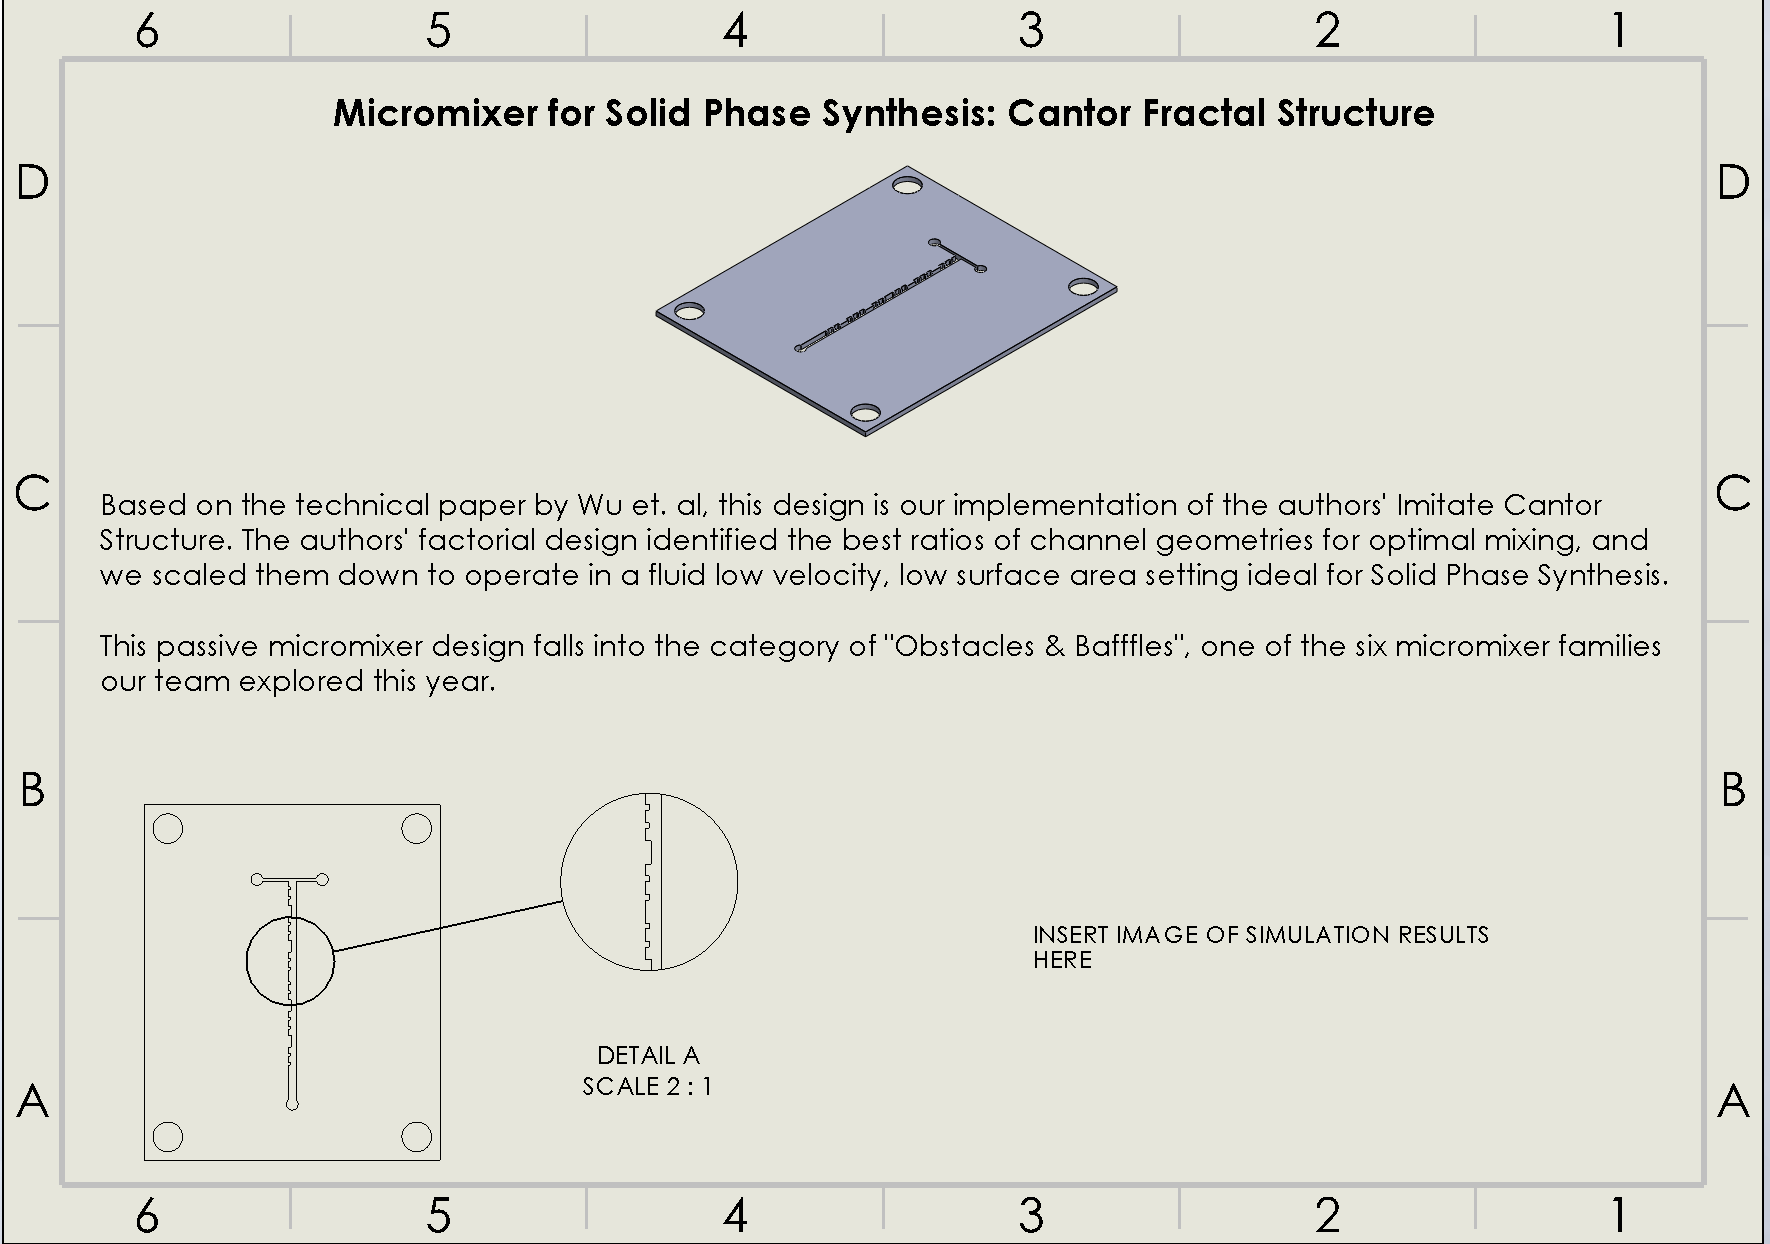
“Cantor” Baffles Chip
Description:
The Cantor Baffles Chip leverages a fractal-inspired baffle design based on Cantor sets, where baffles are arranged in a self-similar, repeating pattern (Wu & Chen, 2019). This fractal geometry enhances the mixing of fluids by creating multiple points of flow disruption at different scales, generating small and large vortices. As fluids pass through the channels, they are subjected to multiple changes in direction, leading to chaotic advection and highly efficient mixing. The Cantor baffles are designed to increase the surface area for fluid interaction without significantly increasing the complexity of the channel layout.
Why was It chosen:
The Cantor Baffles Chip was chosen for its ability to induce efficient mixing through a fractal pattern that optimizes flow disruption across multiple scales. This chip’s unique baffle arrangement ensures thorough mixing with minimal energy input, making it suitable for high-throughput processes such as DNA synthesis. The fractal design promotes mixing at both micro and macro levels, which enhances fluid interaction and reduces dead zones. Additionally, the chip is easy to fabricate using laser ablation, which ensures that the design can be reproduced at low cost and with minimal environmental impact. The fractal baffle structure also minimizes material use while maximizing performance, aligning with the project’s goals of sustainability and scalability.
Testing for the Best Chip with CFD and Titration Experiments
To select the best microfluidic chip design for both SPS and LPS, we produced a set of requirements and evaluation criteria to score and test each design as per the engineering design cycle. All designs must preliminarily pass the requirements to proceed to the scoring stage.
Requirements & Constraints
Physical Constraints
For usability and reproducibility, we produced design specifications for all microfluidic chips that are to be designed. These specifications are modified from Dr. Albert Folch’s BIOEN 455 course at the University of Washington.
- Length of the chip has to be 50.00 mm
- Width of the chip has to be 60.00 mm
- There must be four holes in the corner of every layer, with a diameter of 5.00 mm
- Distance between the center of the four holes to the edge of the chip has to be 4.00 mm
- All inlet and outlet fluidic channel holes have to be 2.00 mm
- The distance between any inlet or outlet hole has to be greater than 10.00 mm
- Layers must be printed in 1mm thick acrylic PMMA plastic
Sheets are to be bonded together by 3M 9495MP double sided adhesive tape
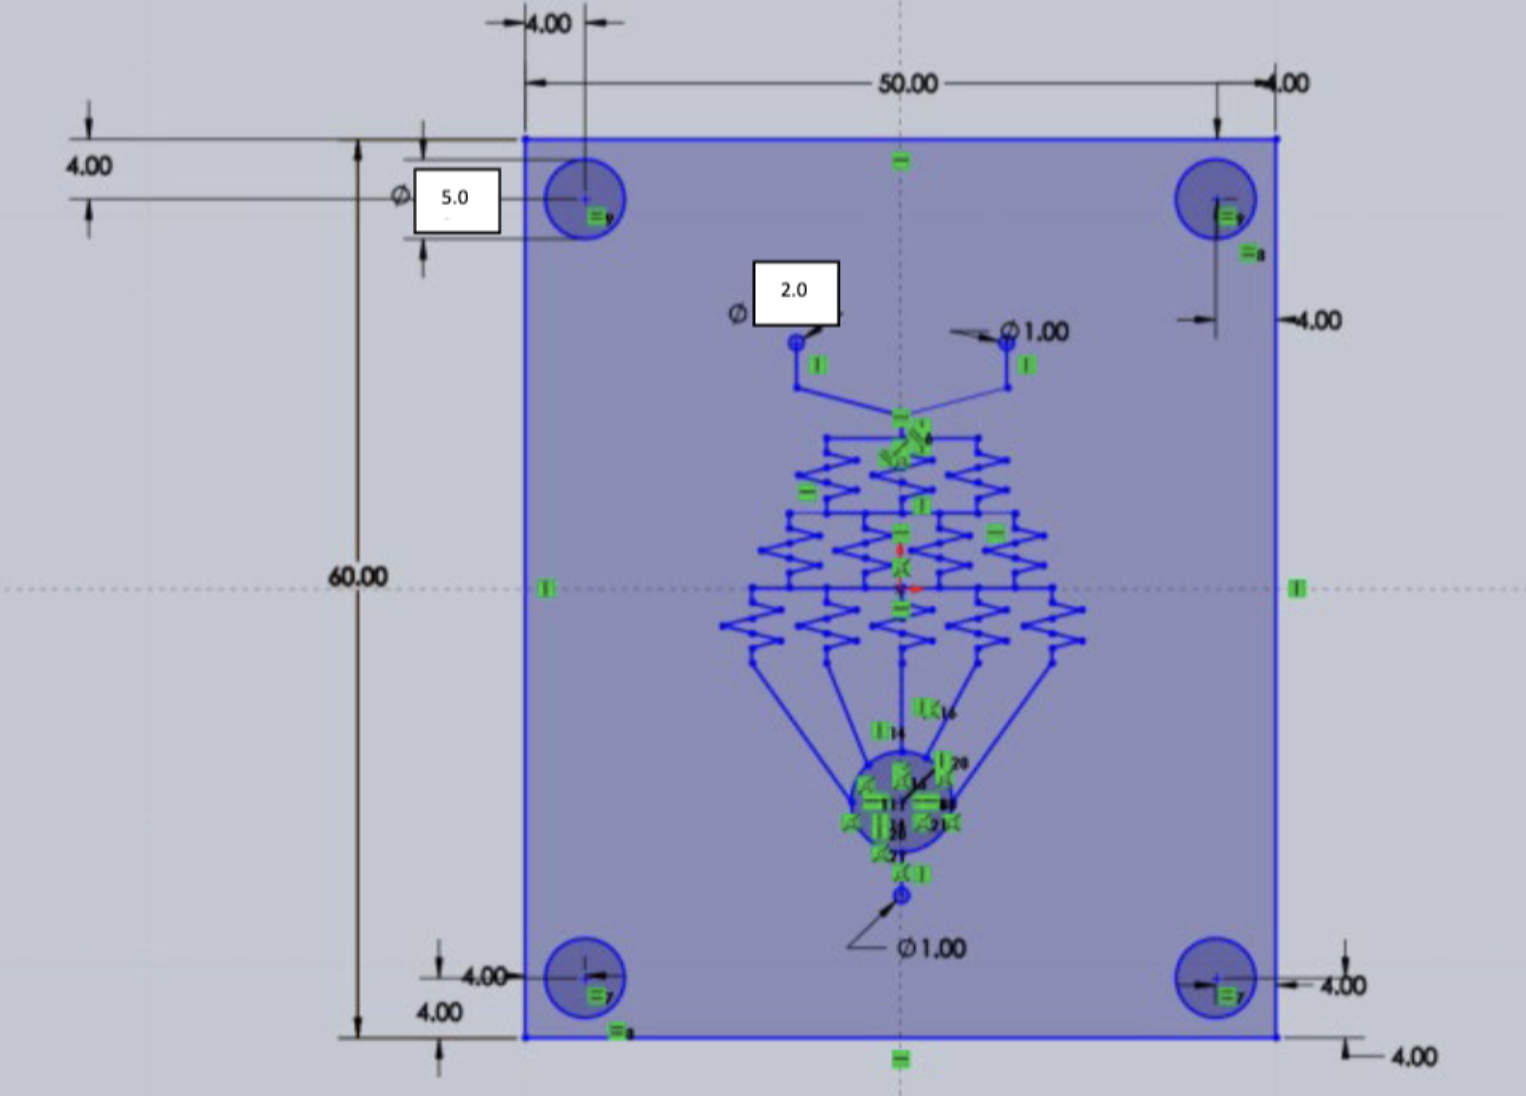
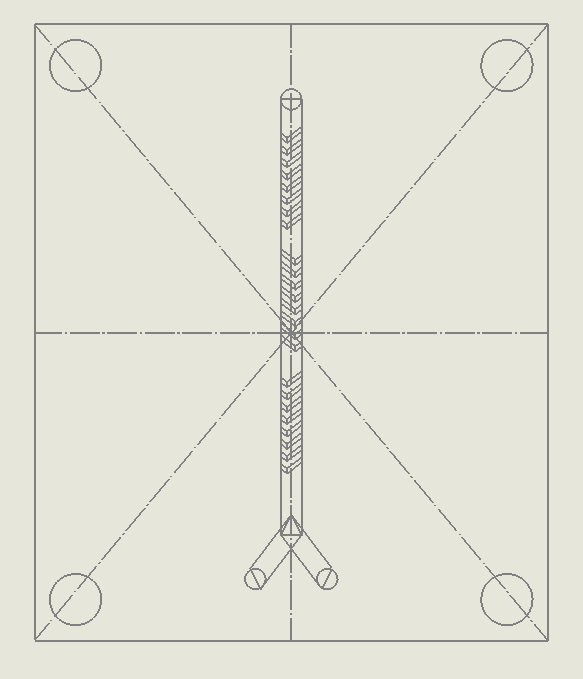
Figure 18. Summary of the design physical contraints.
Design Constraints & Justification Table
| # | Requirement | Justification |
|---|---|---|
| 1 | The temperature used for flow simulations must be 37℃ | This is to simulate the incubation conditions and to provide an optimal environment for DNA. |
| 2 | The face and base chips for each design must be the same. | Ensures reproducibility of inlet/outlet hole location, ensuring uniform nozzle and pumps compatibility. |
| 3 | The fluid velocity used for flow simulations must be 0.000017 kg/s or less. | The most common speed at which researchers run their microfluidics pump is at 1 ml/min or less; our pumps will be running at this speed as well. |
| 4 | Assume that all input fluids behave like water. | Given that the reaction mix quantities (requirement #5) collectively represent an extremely small proportion of the total solution, we assume that the fluid behaves similarly to water in terms of density and viscosity. This helps simplify our Reynolds Number formula derivation and calculation. |
| 5 | Reaction mix for both solid and liquid phase synthesis consists of 10mM Potassium Acetate, 20mM Tris-Acetate, 10mM Magnesium Acetate. | For the above assumption to be true. |
| 6 | The time required to run the flow simulation should not take longer than 5 minutes. | The microfluidic chip designs are simple models such that simulations should not take long to run. To optimize computation power in less powerful hardware, the mesh density should be adjusted such that the runtime should be less than 5 minutes. |
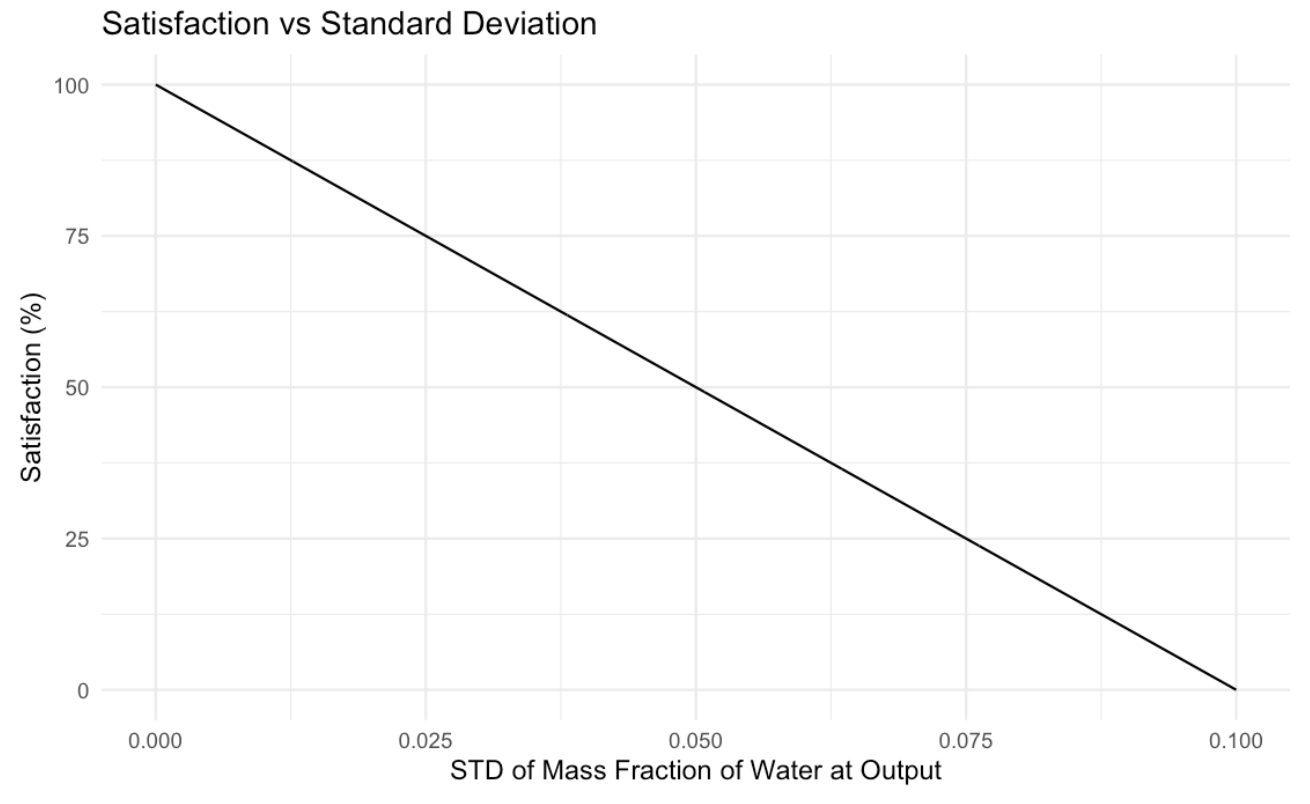
| 7 | The standard deviation of the mass fraction of liquid from the outlet must be less than 0.1. | From the flow simulation, we can determine the mass fraction of input liquid at a large number of points at the output channel. The standard deviation can then be calculated and the closer it is to 0, the more the fluid is mixed. The mass fraction should be 0.5 for perfect mixing at the outlet channel; to ensure that the design is properly mixing, the standard deviation for the mass fraction values should be as close to 0 as possible. |
| 8 | The same guide plate should be used in each design to assemble the layers. | To ensure layers are assembled the same way and on the same rods, between each design for a more streamlined and sustainable manufacturing process. |
| 9 | Chips designed for liquid phase synthesis should have at least 3 layers. | Microfluidic devices can range from 2 to 20 layers depending on their functionality (Chambers, 2021). For LPS, two of the layers should consist of the base and face chip. The face chip is to ensure liquid doesn’t overflow as it flows through the channels. The layers in between will consist of special geometry that differs between each design. Thus, each design should at least have 3 layers in total. |
| 10 | Chips designed for solid phase synthesis should have at least 2 layers. | Same justification as above. For SPS, the face plate is not required since the molecules are synthesizing on a solid material. |
| 11 | Each microfluidic chip should have less than 8 layers. | In consideration of sustainability and complexity, our microfluidic chips are all passive micromixers, which are smaller in size. The most common designs are easily encompassed in three layers or less. |
| 12 | The assembled chips must not leak. | When physically testing the chips, the chips must not leak to ensure that reagents and molecules are not lost when inputted into the channels. |
Evaluation Criteria
Five evaluation criteria and satisfaction curves were produced to score each design. For this, we needed to design experiments and tests that we could conduct, either physically or through simulations, to quantitatively score our designs against a set of criteria. Thus, five testing categories were completed on each LPS and SPS chip to obtain measurable results.
SolidWorks Fluid Simulations
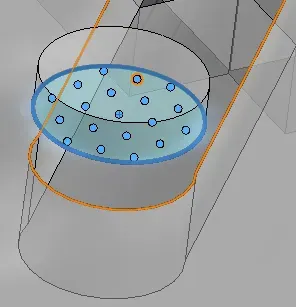
Once the simulation is run and results are calculated, we can then see the flow trajectory and select point parameters to analyze the mass fraction of water at the outlet channel. Intuitively, the outlet channel should be the point at which the fluids should be maximally mixed.
Previously, methods for quantifying mixing between two or more coloured liquids involved a measure of standard deviation through mixing indices (Hashmi & Xu, 2014). Thus, we want to communicate the spread of concentrations that are present at our outlet valve, which would also involve calculating the standard deviation of the mass fraction. The point parameters function provides the mass fraction at 100 points (can be altered) on the outlet channel. The values were then exported into excel to calculate the standard deviation. This measure will tend to 0 as the fluid is mixed more fully.
We therefore produced two evaluation criteria related to the results obtained from these fluid simulations.
Evaluation Criteria #1: Standard Deviation at Outlet Chip
The first criteria will score each design based on the standard deviation value we obtained at the outlet channels. The closer the standard deviation is to 0, the greater the satisfaction as the fluid is mixed more fully closer to 0. This is a linear relationship as satisfaction levels decrease the same when there is an increase in standard deviation.
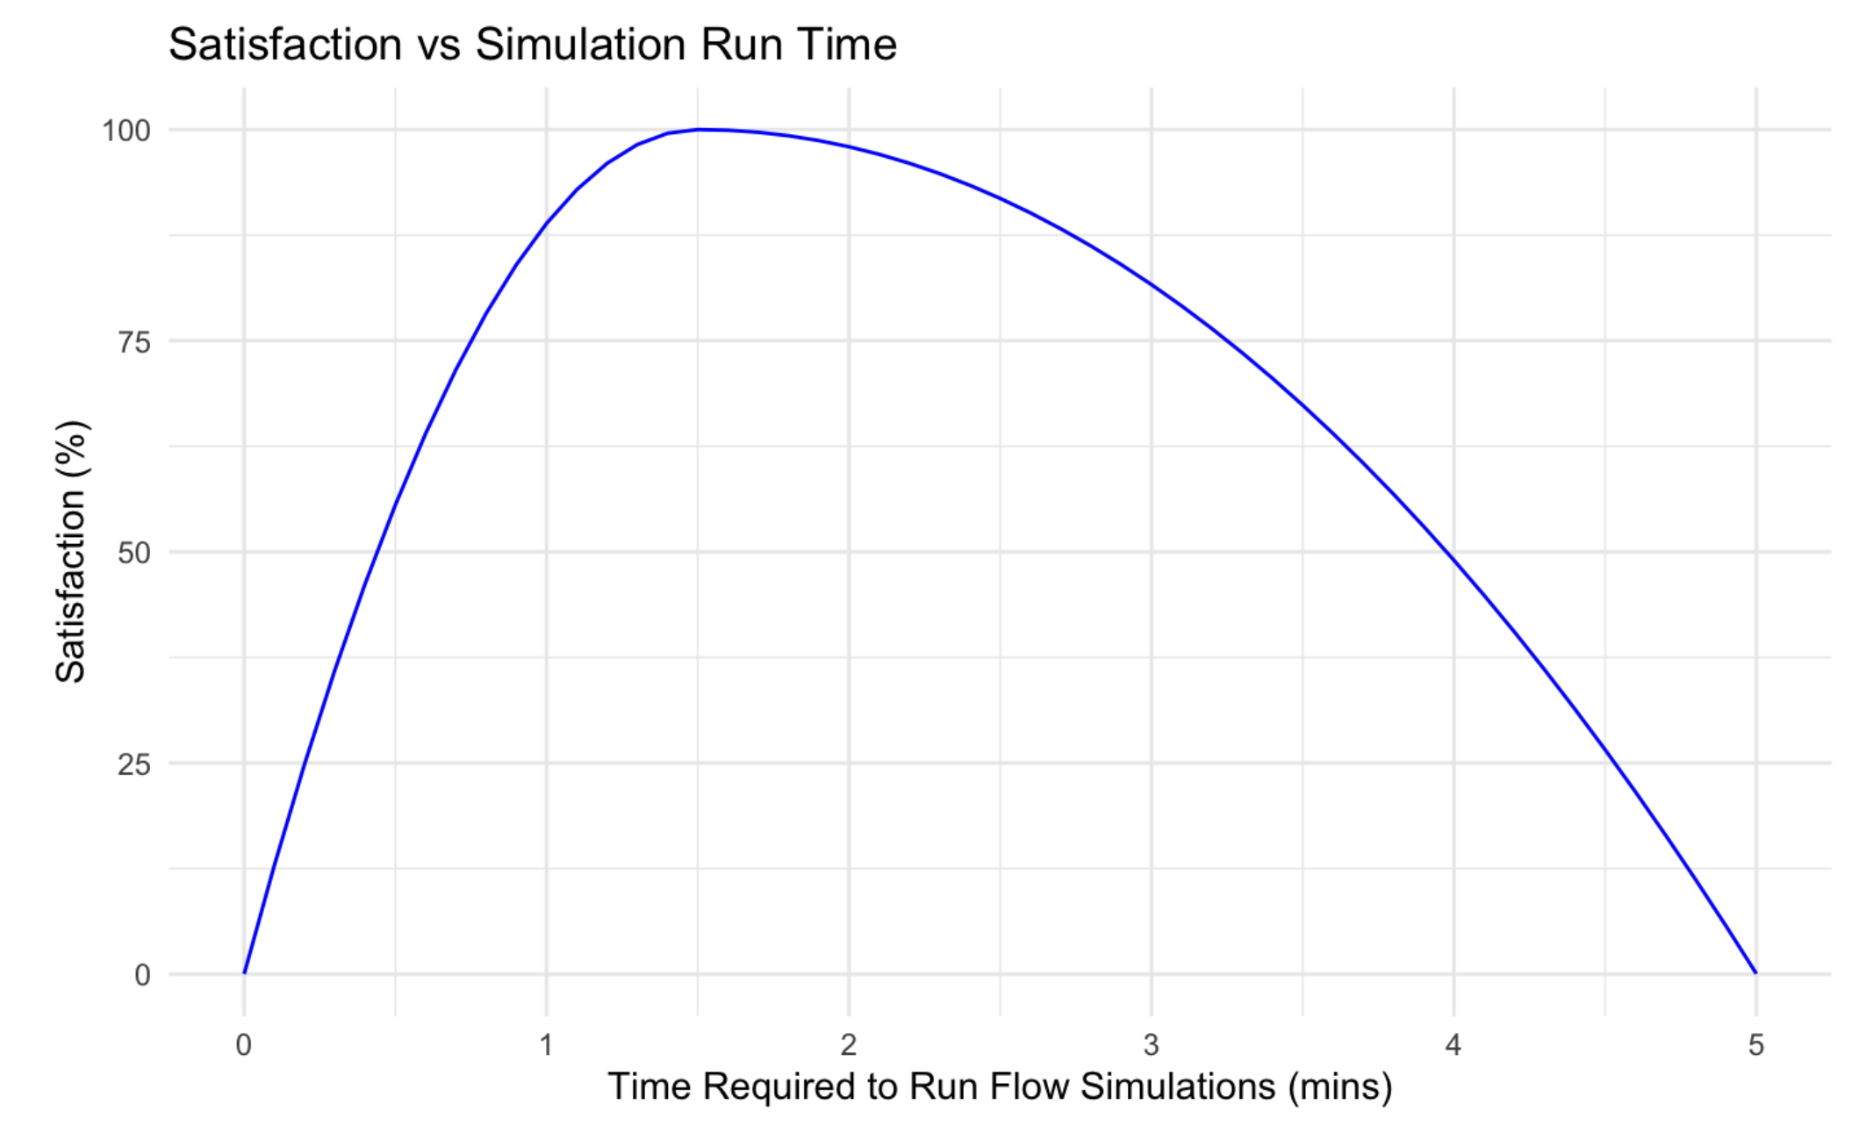
Evaluation Criteria #2: Simulation Run Time
The second criteria will score each design based on the time it took for the simulation to run and calculate results. The runtime would represent how easy and quickly the mixing and experiment will occur in the lab. A piecewise optimum curve was used to take into consideration the accuracy of our simulation model. The mesh density must be decreased for a very fast runtime, which would decrease the accuracy of the analysis results. Thus, to optimize both accuracy and runtime, max satisfaction would occur at 1.5 minutes, the standard time required to run a flow simulation at a medium-mesh density of 4.
Microfluidic Titration Experiments
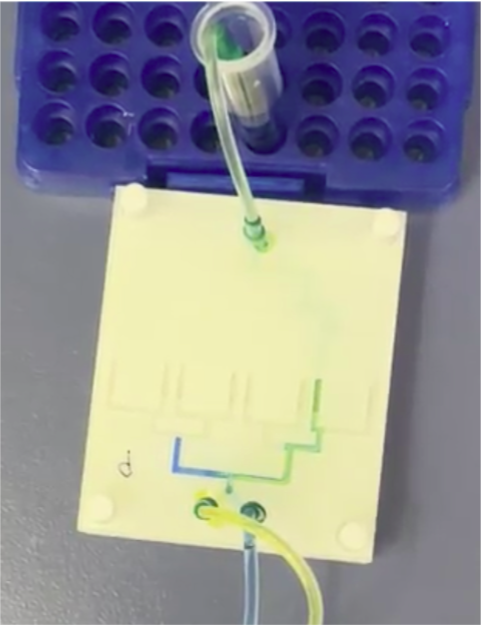
Following laser printing all our chip designs, we thought of a simple titration experiment to physically test the mixing efficiency of each chip. We used two syringe pumps, which would pump NaOH through one inlet and HCl through another inlet. The base and acid would have an indicator, bromothymol blue, added to them, which would indicate blue for base and yellow for acid. As the strong base and acid mixes throughout the chip channels, it would neutralize to a green color at the outlet hole.
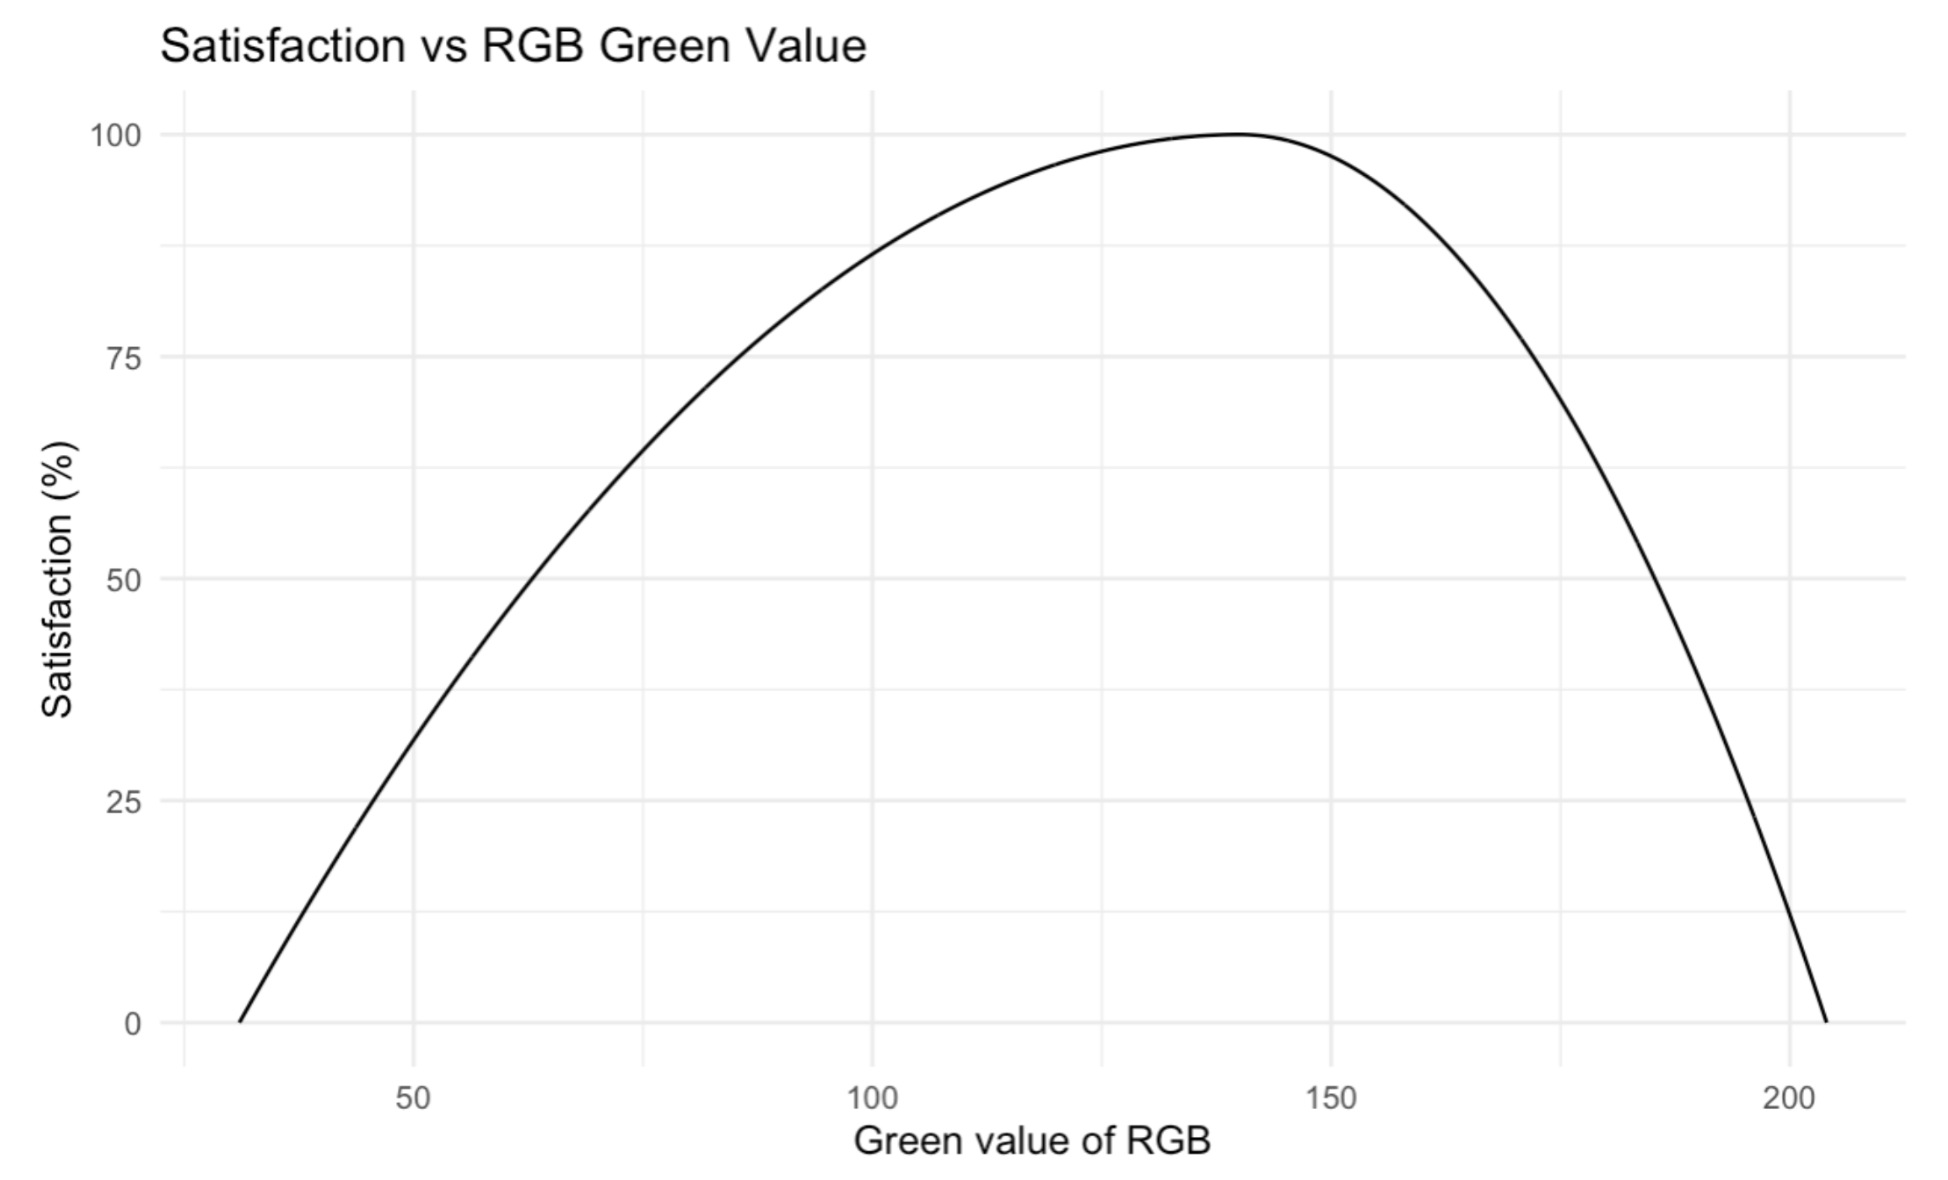
Evaluation Criteria #3: Titration Colour Value
Using a digital color meter, the hexadecimal # and RGB values of the liquid color at the outlet channel were measured. The RGB values of the neutralized green, most basic blue, and most acidic yellow were used as references to compare against to produce the satisfaction curve. A piecewise optimum curve was used as anything above the neutralized green color is considered too yellow / too acidic and anything below is considered too blue / too basic. The minimum values were obtained from the most basic blue color and the most acidic yellow color. Anything above or below the neutralized green value would lower the satisfaction.
Evaluation Criteria #4: Plastic Waste
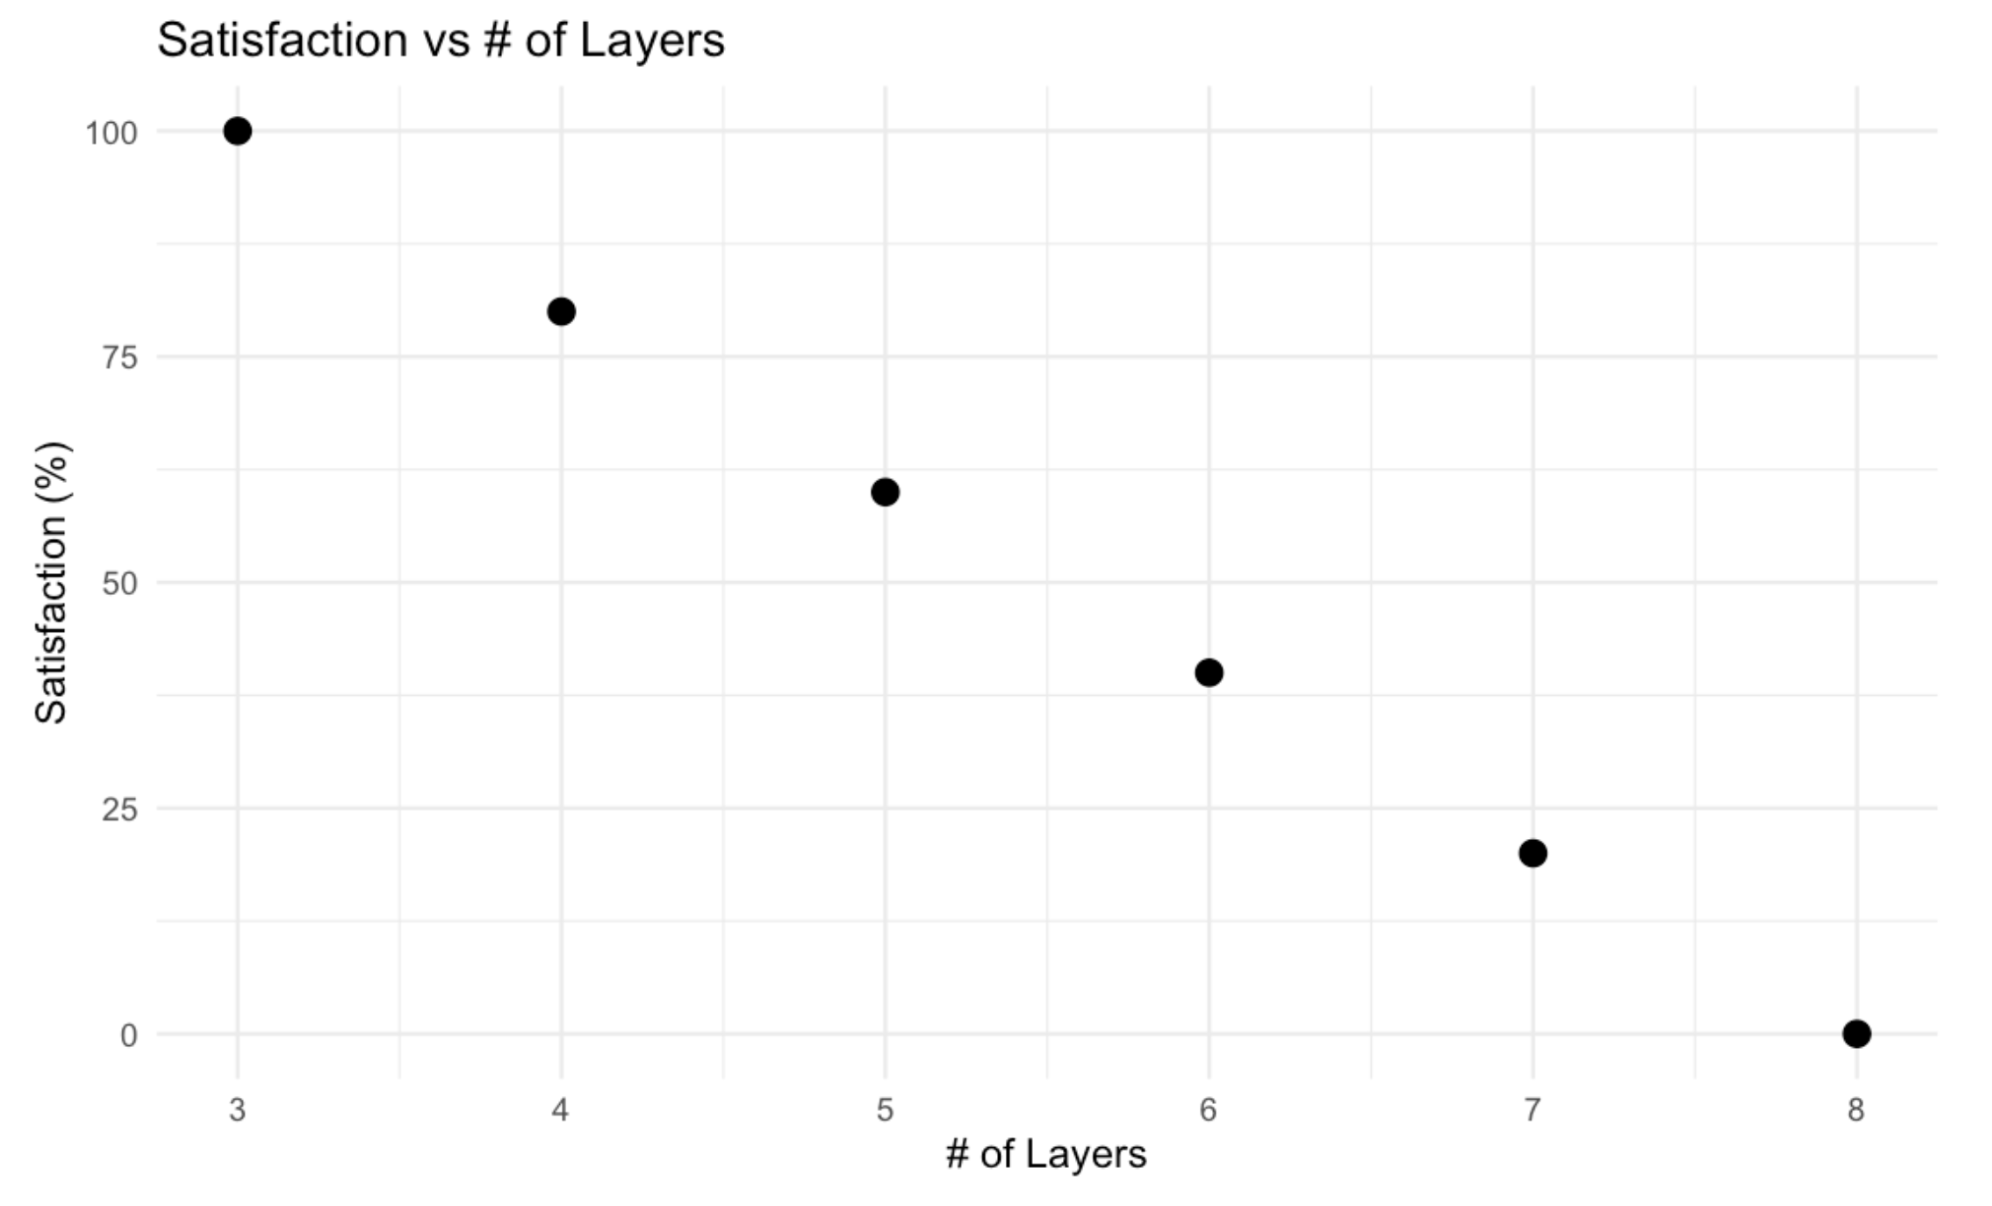
While implementing microfluidic chips in our workflow encourages a more sustainable use of reagents and reactions, we need to ensure the manufacturing process is as sustainable as possible. Some designs have differing complexity and differing amounts of layers. Each layer is made out of PMMA plastic; thus, to evaluate our plastic use, satisfaction decreases with more plastic layers. It is discrete since layers are either 3, 4, 5, or 6. Maximum satisfaction is at 3 layers since all LPS designs have the same base and face chip, with a minimum of one specially designed chip in between (SPS can have 2 layers). The maximum layer of 8 is decided upon design requirement #11.
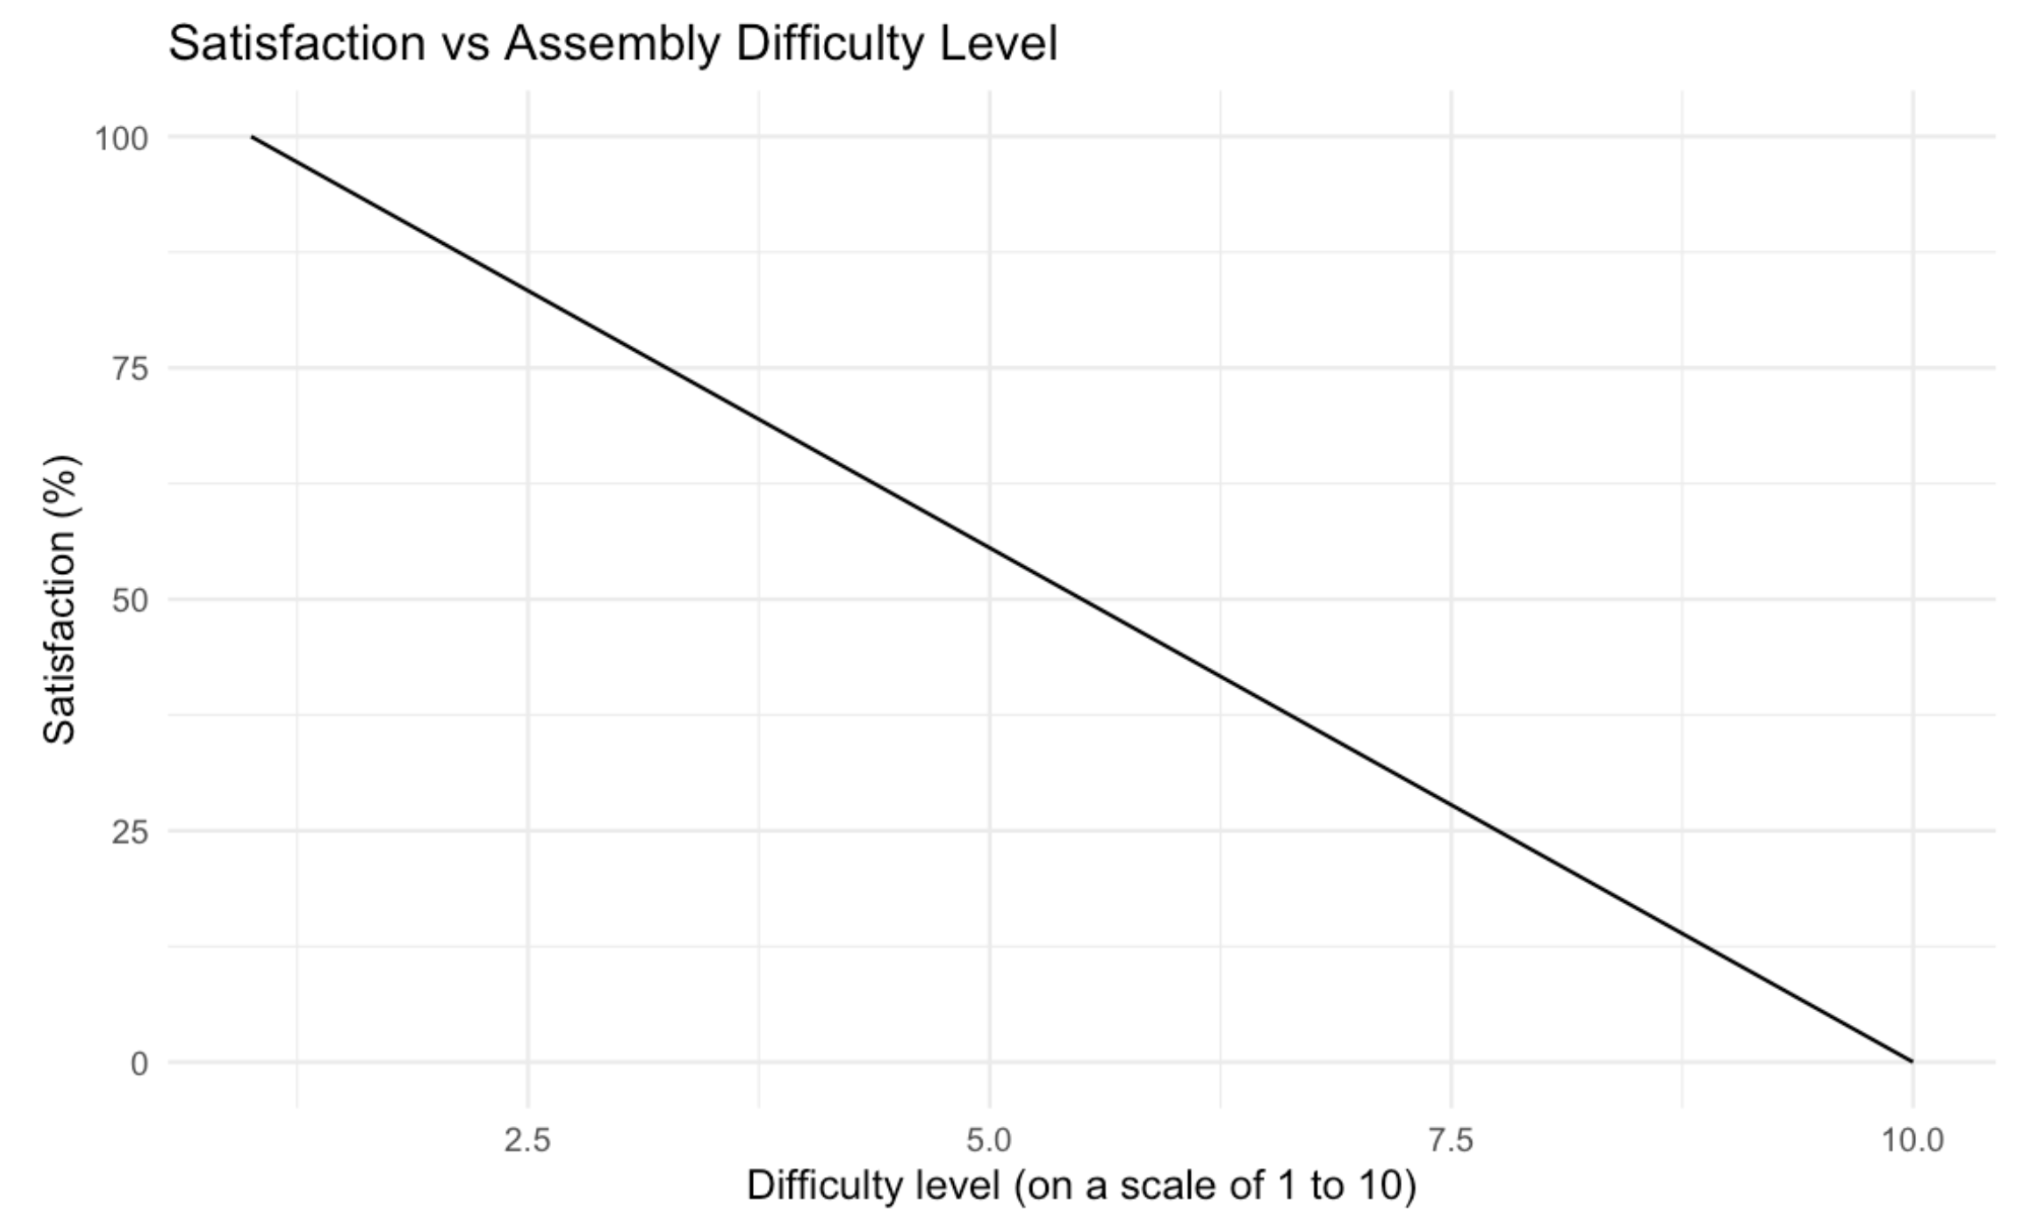
Evaluation Criteria #5: Assembly Difficulty
Following the laser ablation of each chip, plastic bits must be manually removed and each layer has to be assembled. Depending on the intricacy and complexity of the channel design, some layers may require a microscope to carefully remove microscopic bits of plastic. The placement of adhesive also affects how easy it is to assemble each layer. Based on these factors, the difficulty in assembling each design can differ. Thus, individuals that contributed to assembling each chip are asked to qualitatively determine the difficulty on a scale of 1 to 10. More satisfaction is associated with decreased difficulty, thus, a decreasing linear plot is used.
Evaluation Results
LPS Experiments & Simulations
Here, we included the results from our SolidWorks Flow Simulations and Titration Experiments for each of the LPS chips. We can observe how our computational simulations are actually reflected in realistic, in-lab experiments with the chips.
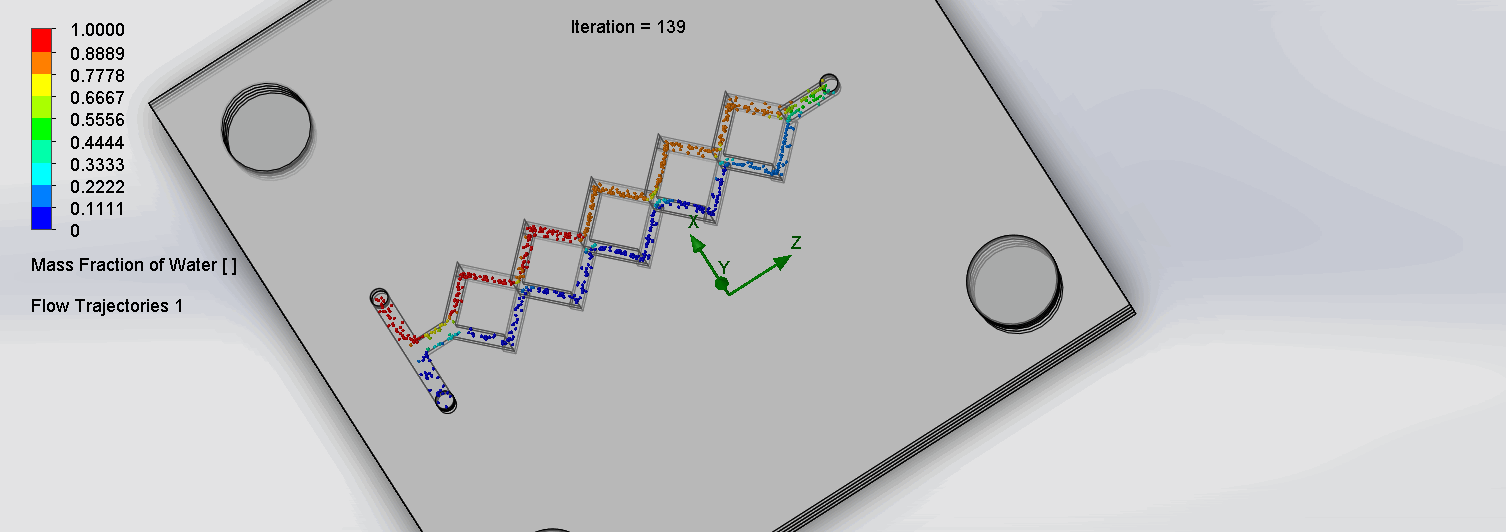
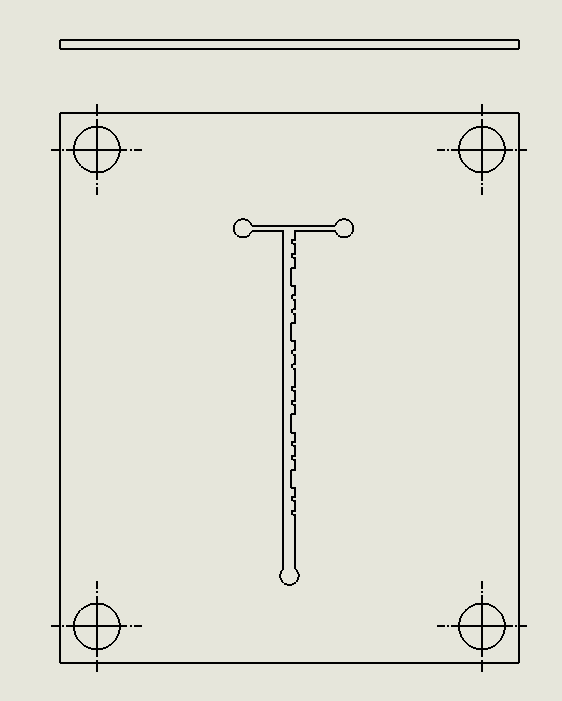
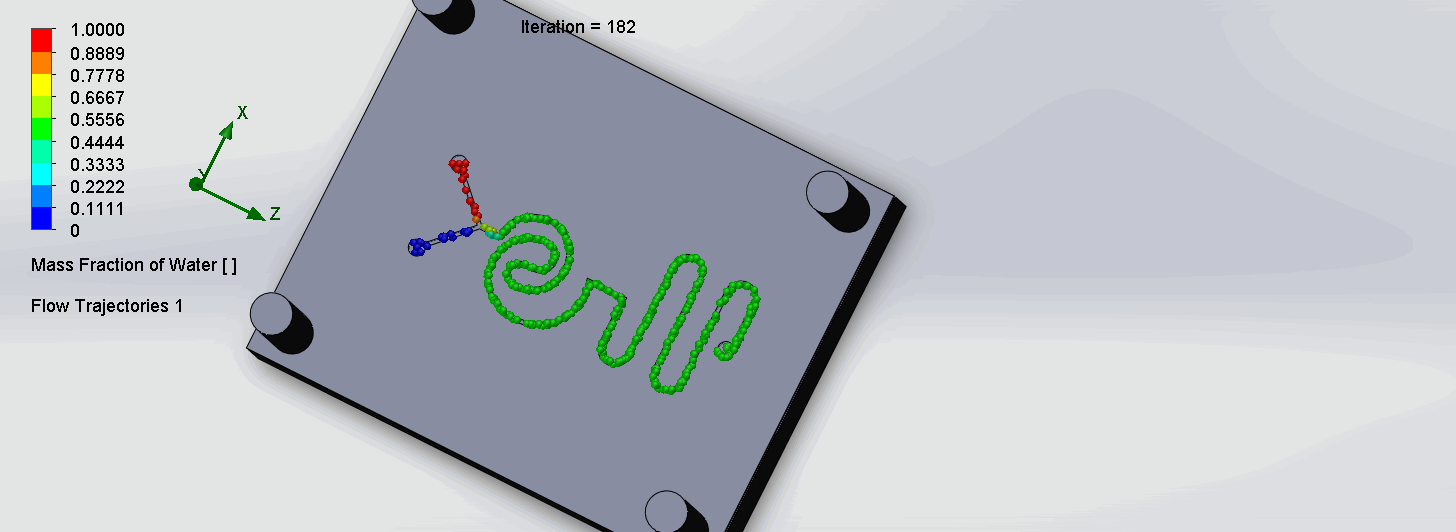
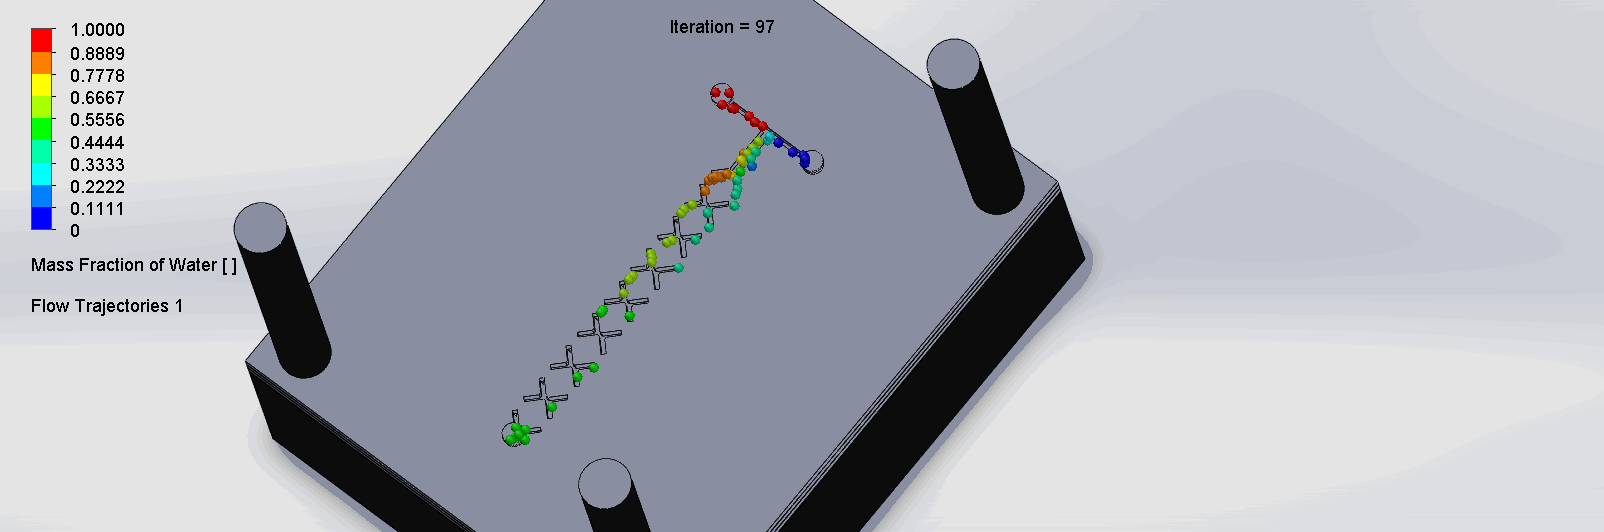
”Herringbone” Helix Flow Chip
We can see that the two inlet liquids are being mixed at the intersection of the Y. Molecules are rocking back and forth at the chevrons, allowing mixing to occur.

“Binary Tree” Multilamination Chip
We can see that the liquid was not able to flow through the outer channels, which indicates a flow dead zone, leading to no mixing in those areas. The amount of molecules flowing through the left and right channels are also disproportionate. This simulation result was consistent with in-lab results as we observed the fluid flowing much slower through the left channel than the right, and no fluid flowing through the outer channels. Possible explanations for the flow dead zone formations could be that the sharp corners leading to multiple channels could have significantly decreased the flow velocity. While assembling the layers on SolidWorks, the layers may have been slightly uneven or asymmetric, leading to imperfect splitting / combining of the channels.

“Pinball” Contraction and Expansion Chip
The molecules are flowing around the pinball obstacles through the two layers, promoting mixing. By observing the colours, the liquid is pretty well mixed right when the two liquids meet, at the intersection.

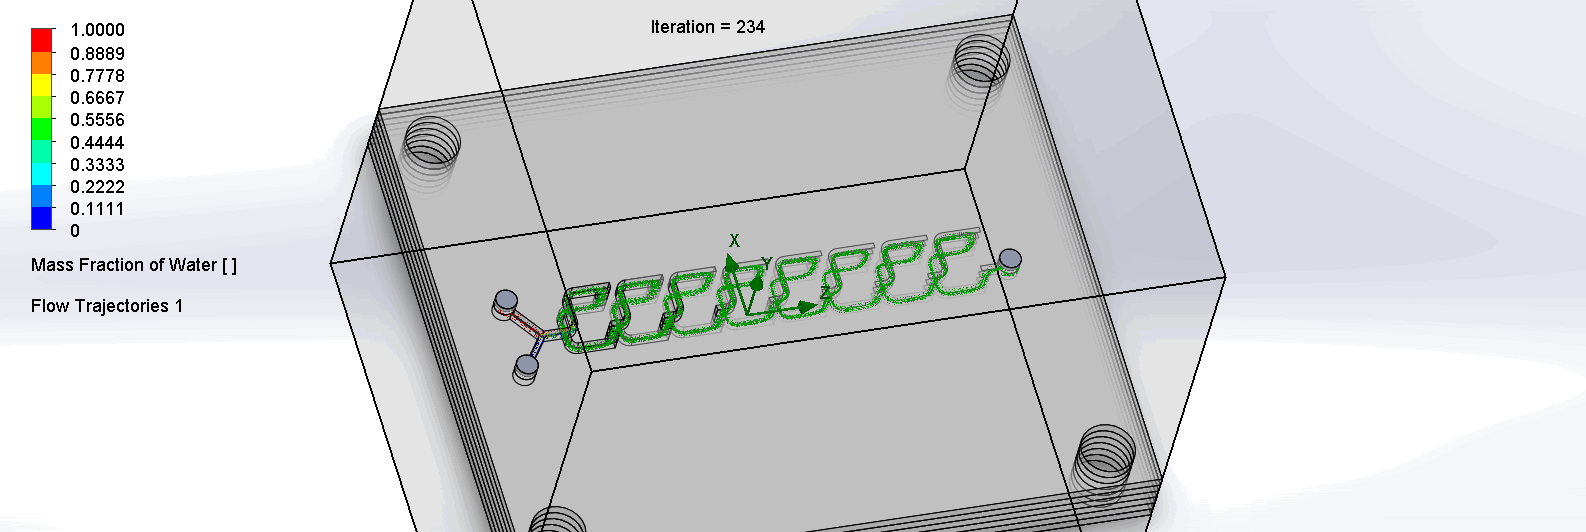
“Countered Spirals” Dean Vortices Chip
The two liquids are mixed well at the intersection of the inlet channels as it enters the spirals. The molecules flows through the spirals smoothly, as it alternates flow directions, become increasingly well mixed as it goes down the channels.
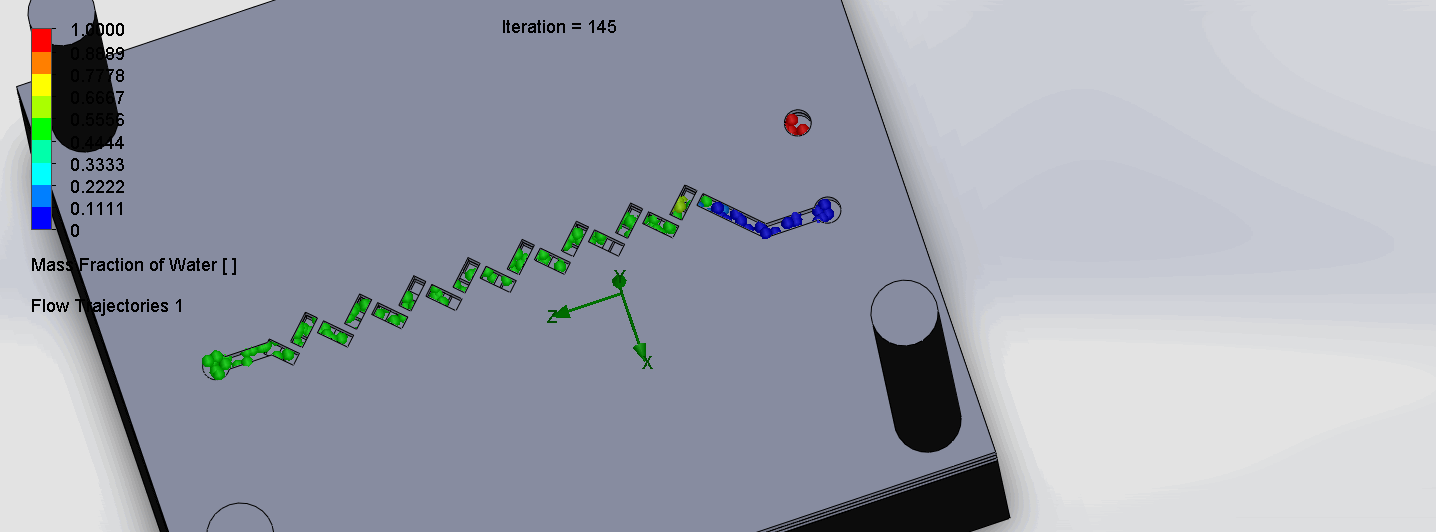
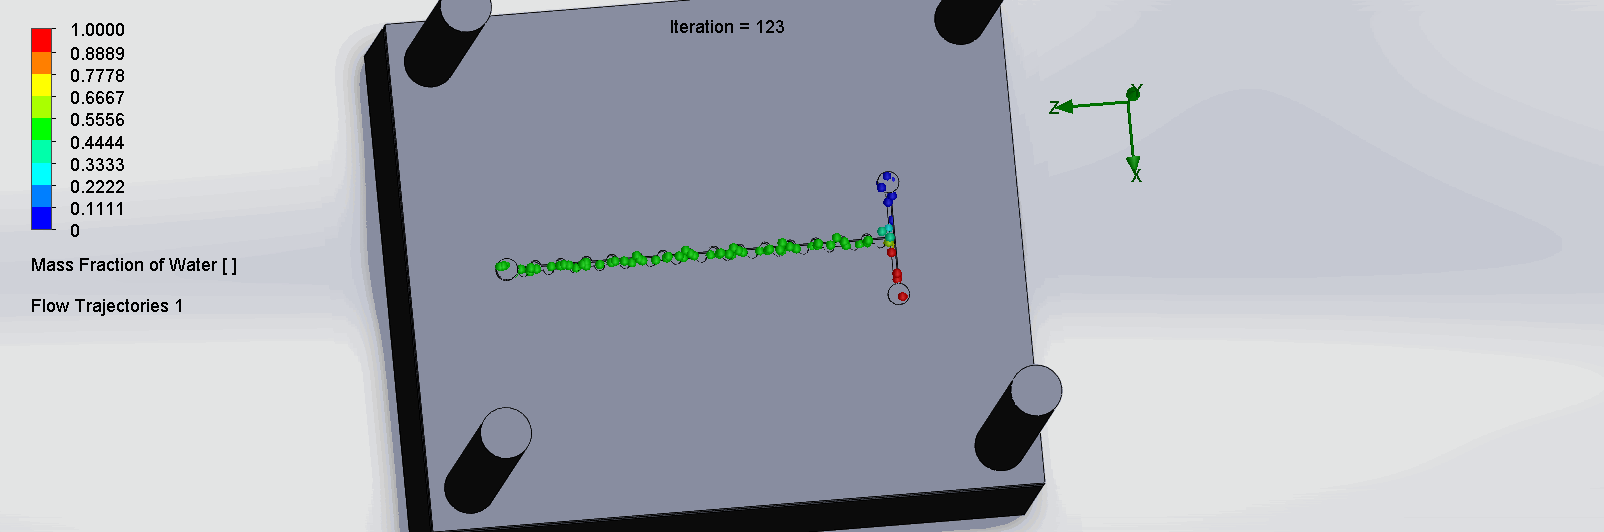
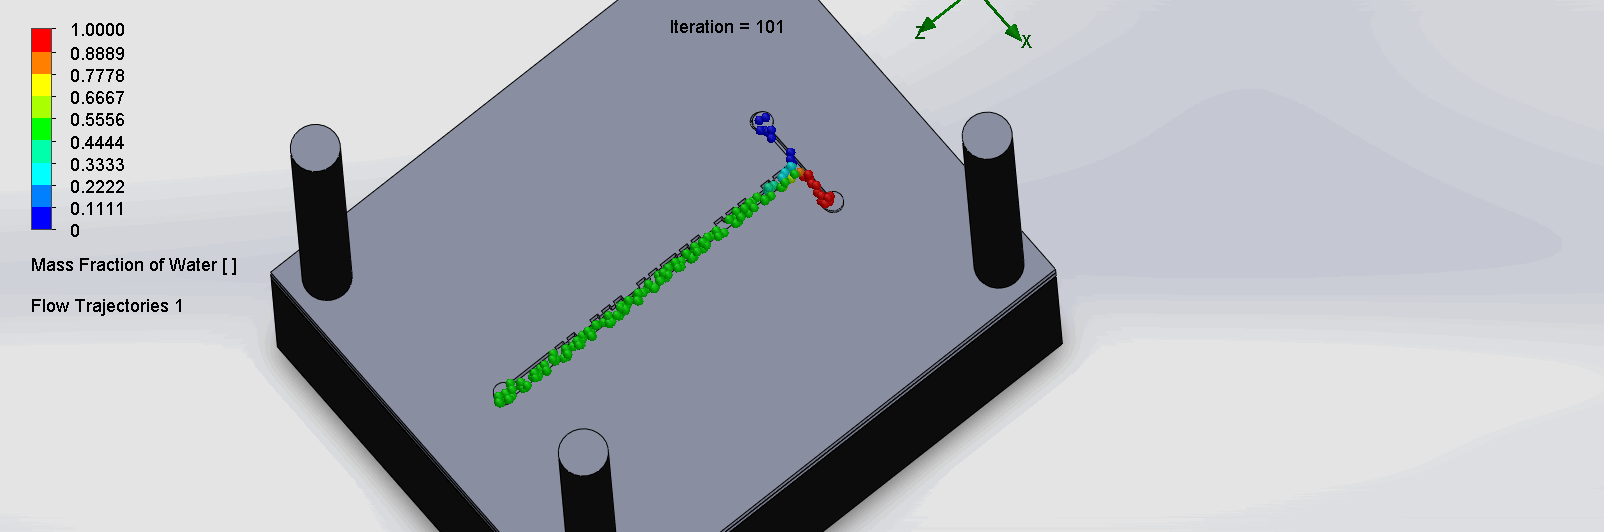
“F Channel” Split and Recombination Chip
The two liquids are mixed well after flowing through the first “F”. The molecules are divided relatively evenly at the F arms, which are then combined before moving onto the next “F”.

“Criss-Cross” Split and Recombination Chip
The two layers come together to form criss-cross shaped channels, where the molecules overlap in alternating directions at each criss-cross. The molecules are then recombined and mixed before reaching the next criss-cross.
Titration Experiment Results
Footage from our Titration Experiments was compiled into the video below:
SPS Experiments & Simulations
“Fin Shaped” Baffles Chip
We can see that the two inlet liquids are being mixed right at the intersection, before entering the channels. At each “fin”, the baffles create swirls of the molecules to enhance the mixing of the liquid.

“Serpentine” Dean Vortices Chip
We can see that the two input liquids are being mixed right at the intersection, before entering the curved channels. The molecules flow smooth through the curves, allowing the formation of dean vortices.
“ZigZag” Contraction and Expansion Chip
We can see that the two input liquids are being mixed right at the intersection, before entering the channels. The zipper design facilitates mixing by quickly expanding then contracting the molecules interchangeably throughout the channel.
“Planar” Split and Recombination Chip
We can see that the two input liquids are being mixed throughout the channels, and interleave as they enter the channels. The X shaped channels split the molecules and are then recombined at the outlet hole.
“Cantor” Baffles Chip
We can see that the two input liquids are being mixed very quickly at the intersection, before entering the fractal-like channels. As the molecules contact each sub
Due to time constraints and reagent availability, we were unable to run the titration test experiment on the SPS chips. Thus, removing this criteria, the 30% was redistributed.
- 9% was given to the evaluation criteria #1 which corresponded to the simulation results, the only other test that tests for mixing efficiency.
- The rest of the 21% was distributed evenly among the other three criteria.
Selecting Best Chip Using a Weighted Decision Matrix
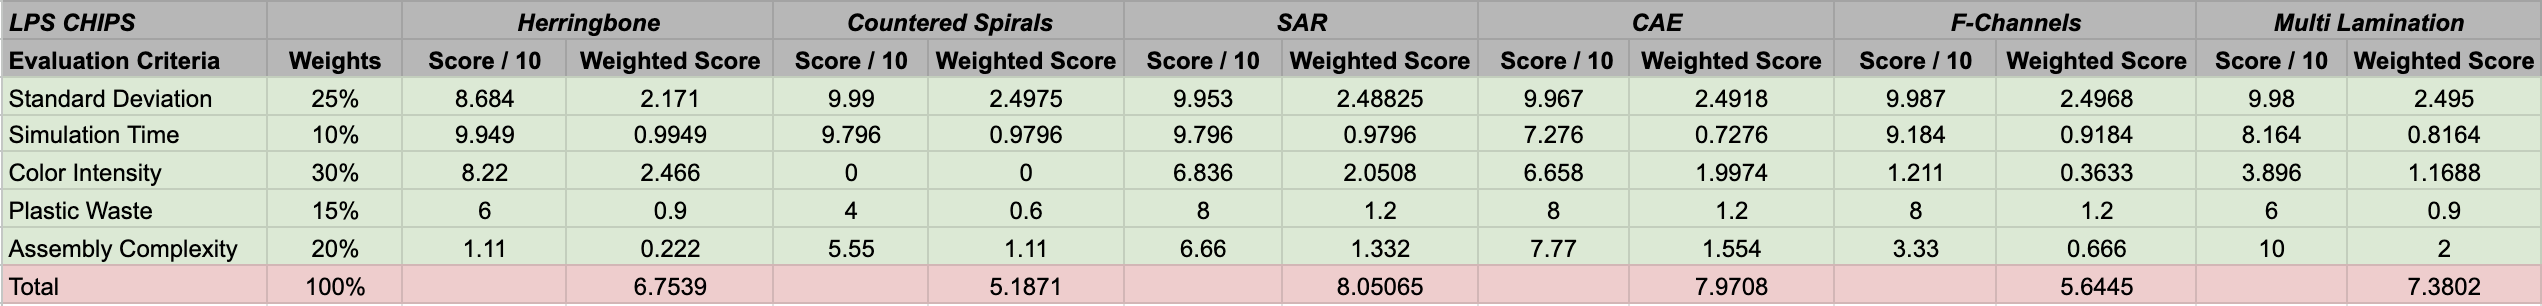
Finally, using the obtained results from the tests, we can rank each of our microfluidic chips.
To do so on a scoring matrix called the Weighted Design Matrix (WDM), we have to assign different weights to each evaluation criteria.
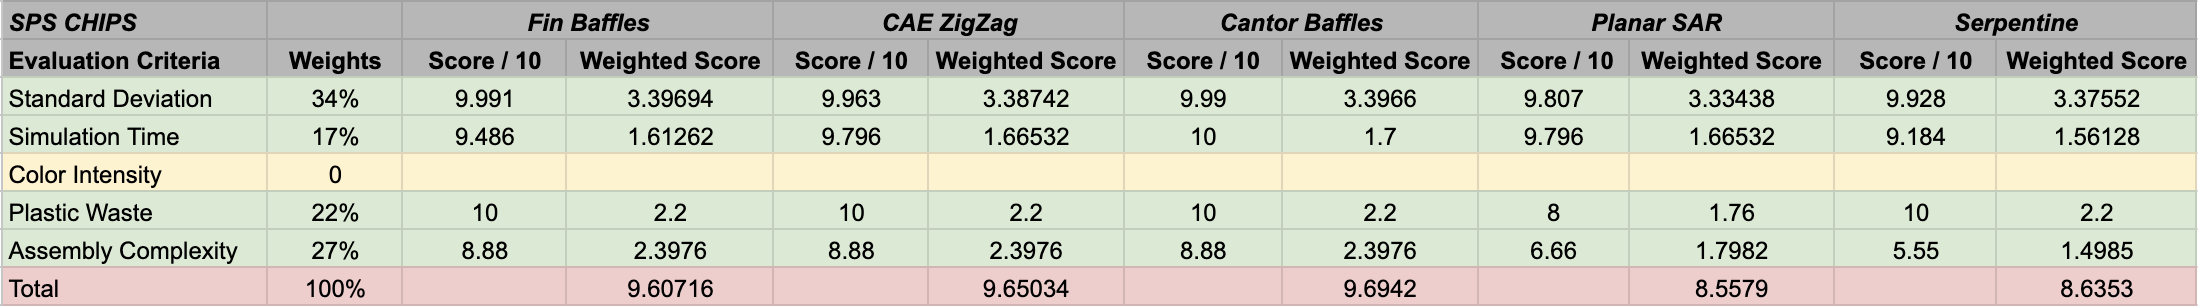
- The highest weighted criteria is the color measurement (30%), our main metric for quantifying how efficient each design is at mixing in reality. This criteria may also be the most variant between the designs, providing an important metric to score and rank the designs based on efficiency. Errors and drawbacks in the assembly and set up processes will be more apparent in these tests compared to simulations.
- Standard deviation values weighted at second highest (25%), which quantifies how efficient each design is at mixing through computational means.
- Assembly complexity was weighted at 20%, which would affect how well the chips are assembled, the final set up for the wet lab members, and the mixing efficiency.
- Plastic waste was weighted at 15%, considering its importance in the sustainability aspect of our project.
- Simulation runtime was the lowest weighted criteria at 10%, which is not of concern to our wet lab experiments, but represents how accurate our simulations are and the required computational power.
According to the WDMs attached below, the winning LPS design was the SAR chip, and the winning SPS design was the Cantor Baffles chip.
Validation of Design with Wet Lab Experimentation
Run 1 Learn
The recovery of the fluorescent oligonucleotide was poor. This was evidenced by the faint band signal intensity in the DNA gel, suggesting that the amount recovered was lower than the Typhoon biomolecular imager’s detection limit.
Of the faint bands observed, the evidence of primer elongation by ThTdT in LPS was inconclusive. Both research questions require further investigation in the next cycle.
Run 2 Design
To address the non-specific binding hypothesis, and experiment with a comparator (control) and intervention arm is devised. The intervention, using plasmids as blocking agents, is inspired by Enzyme-Linked ImmunoSorbent Assay (ELISA). In this assay, analytes were absorbed onto a solid support non-covalent. To ensure specificity, a relative low cost protein was sacrificially applied to block the surfaces that were not supposed to react. Common examples include fetal bovine serum (FBS), bovine serum albumin (BSA), and fat-free milk power. While it would be easy to use common nucleic acids carriers, such as tRNA and salmon sperm DNA, for the purpose of blocking, the presence of free 3’-ends will compete resources over nucleotides during the elongation reaction. Therefore, plasmids were chosen since they are DNA will no free 3’-termini.
Run 2 Build
A two part experiment was proposed to study the effect of non-specific binding and reaction manifolds. In part 1, the effect (with vs. without use) of the microfluidic chip was studied, with the following experimental plan:
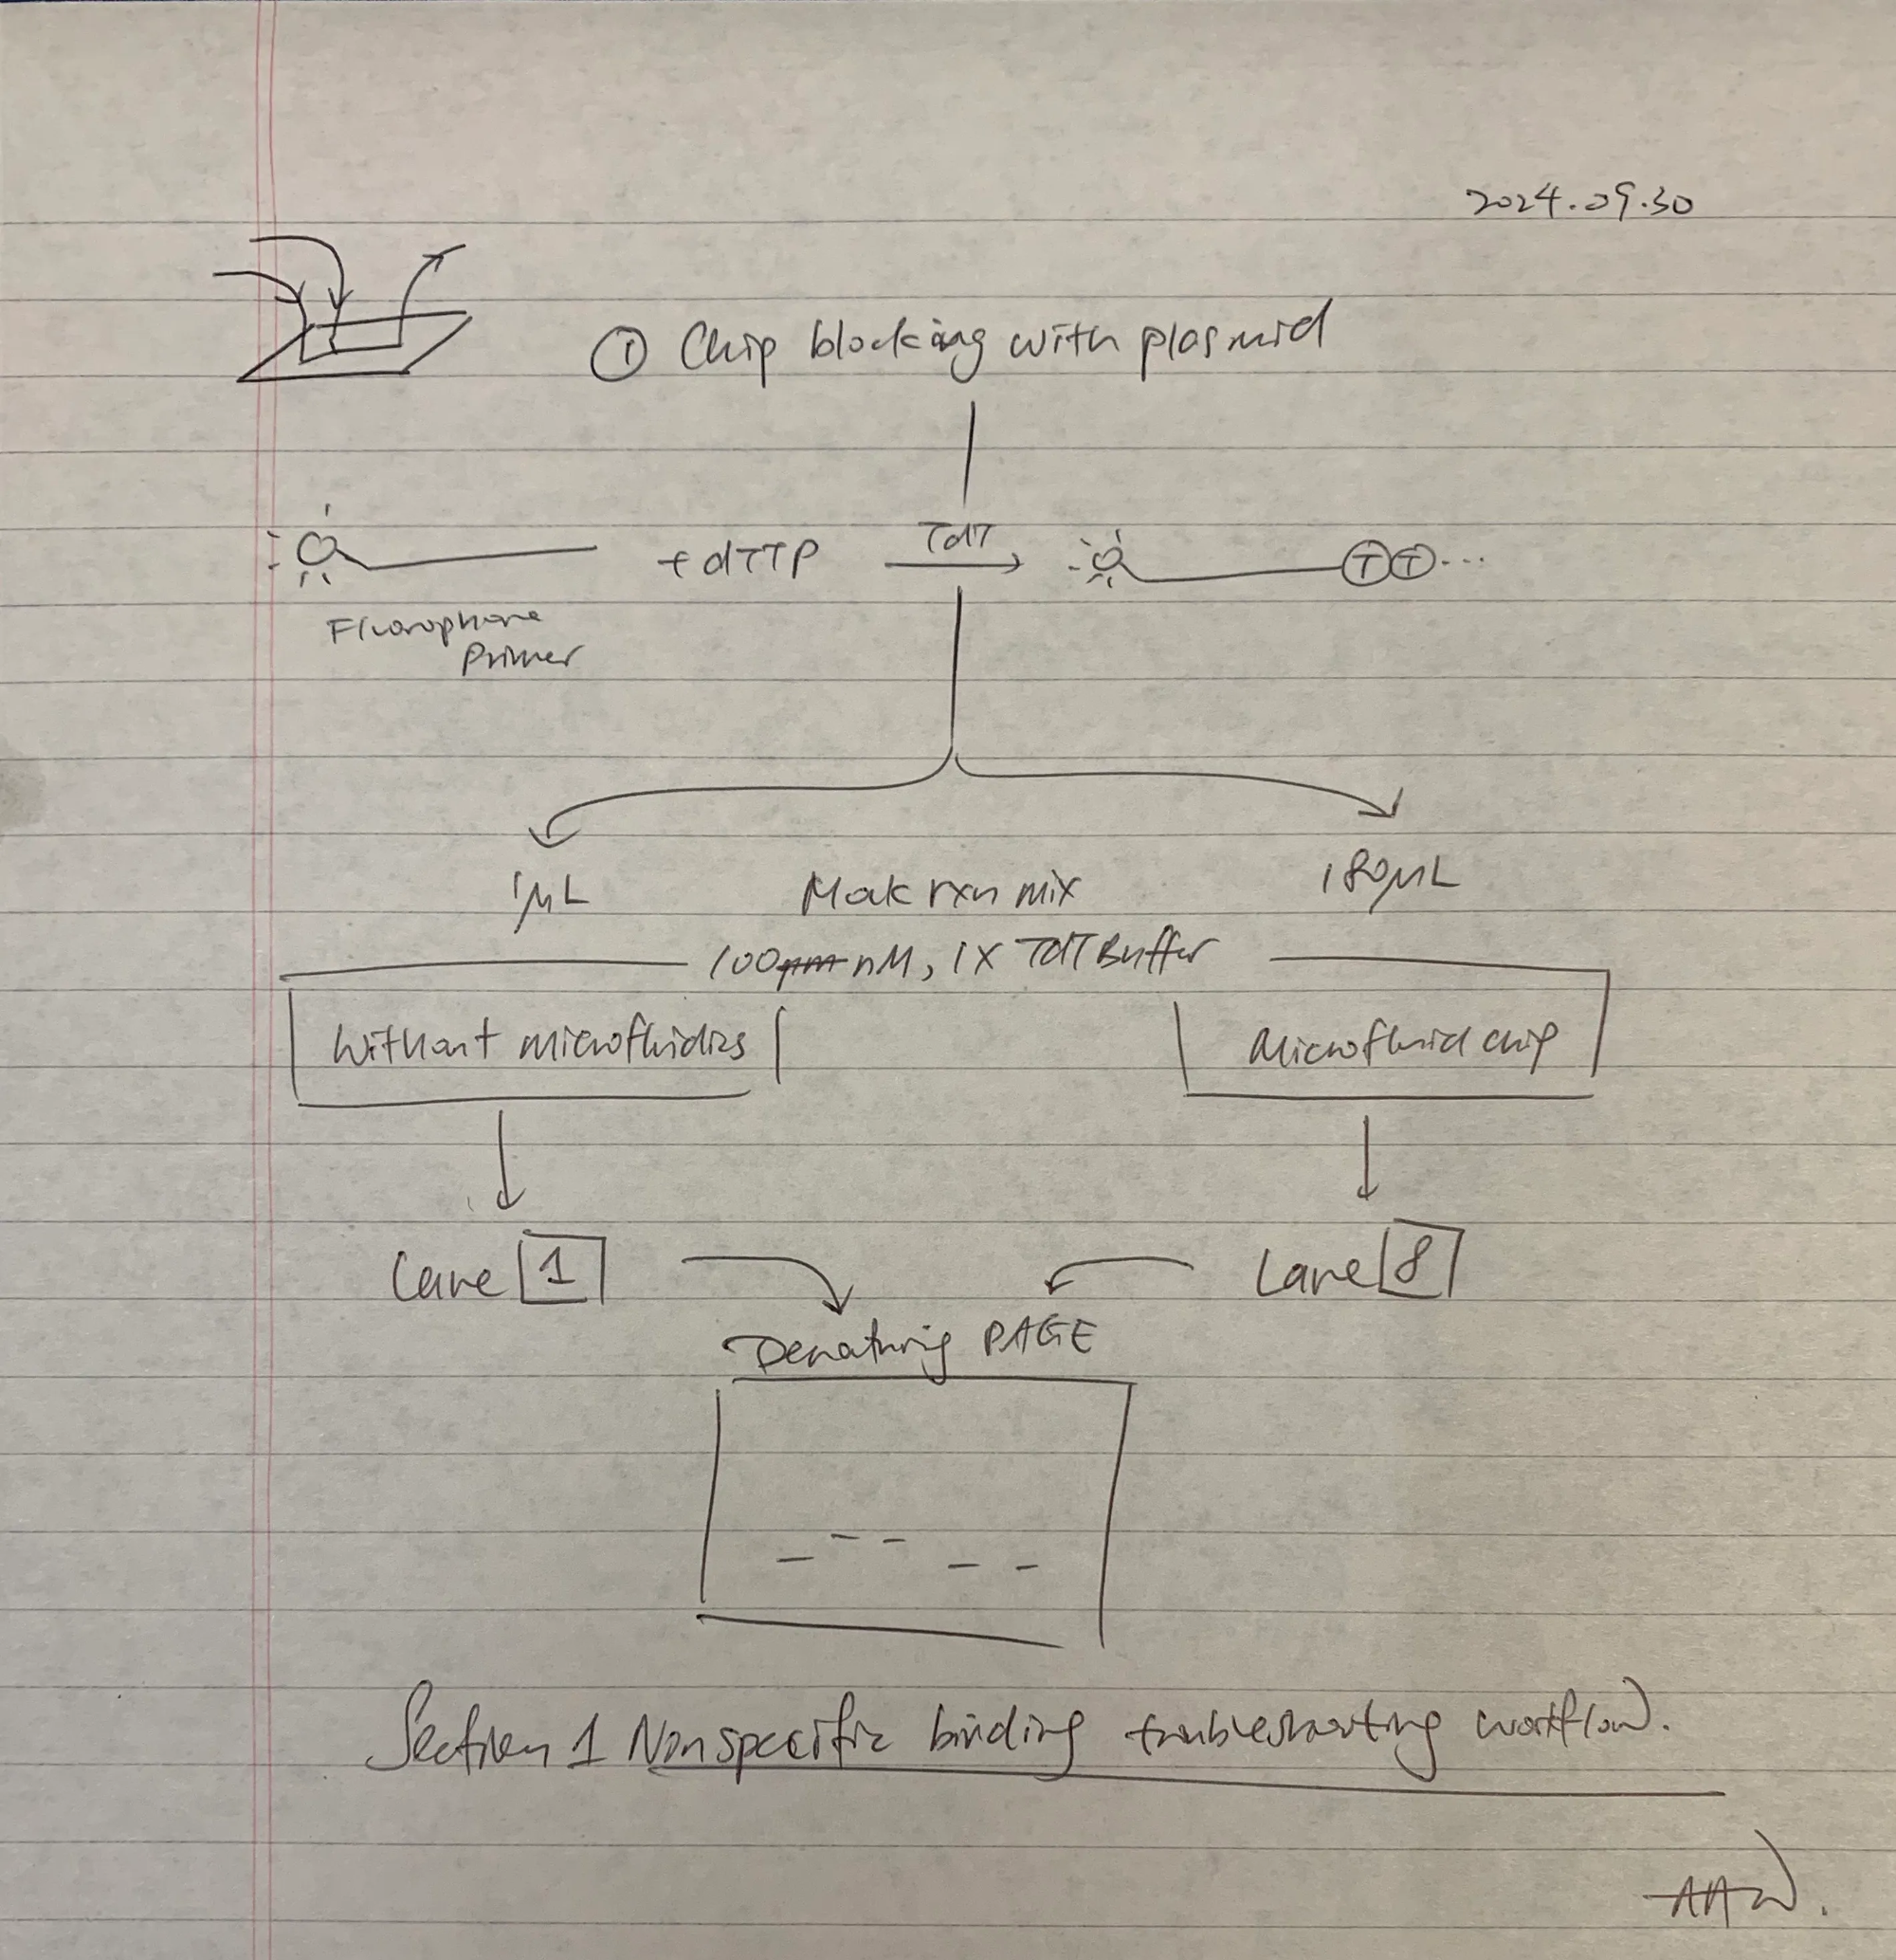
In anticipation for this test, the chip was blocked by plasmid pET-28b prior to microfluidic LPS.
Run 2 Test
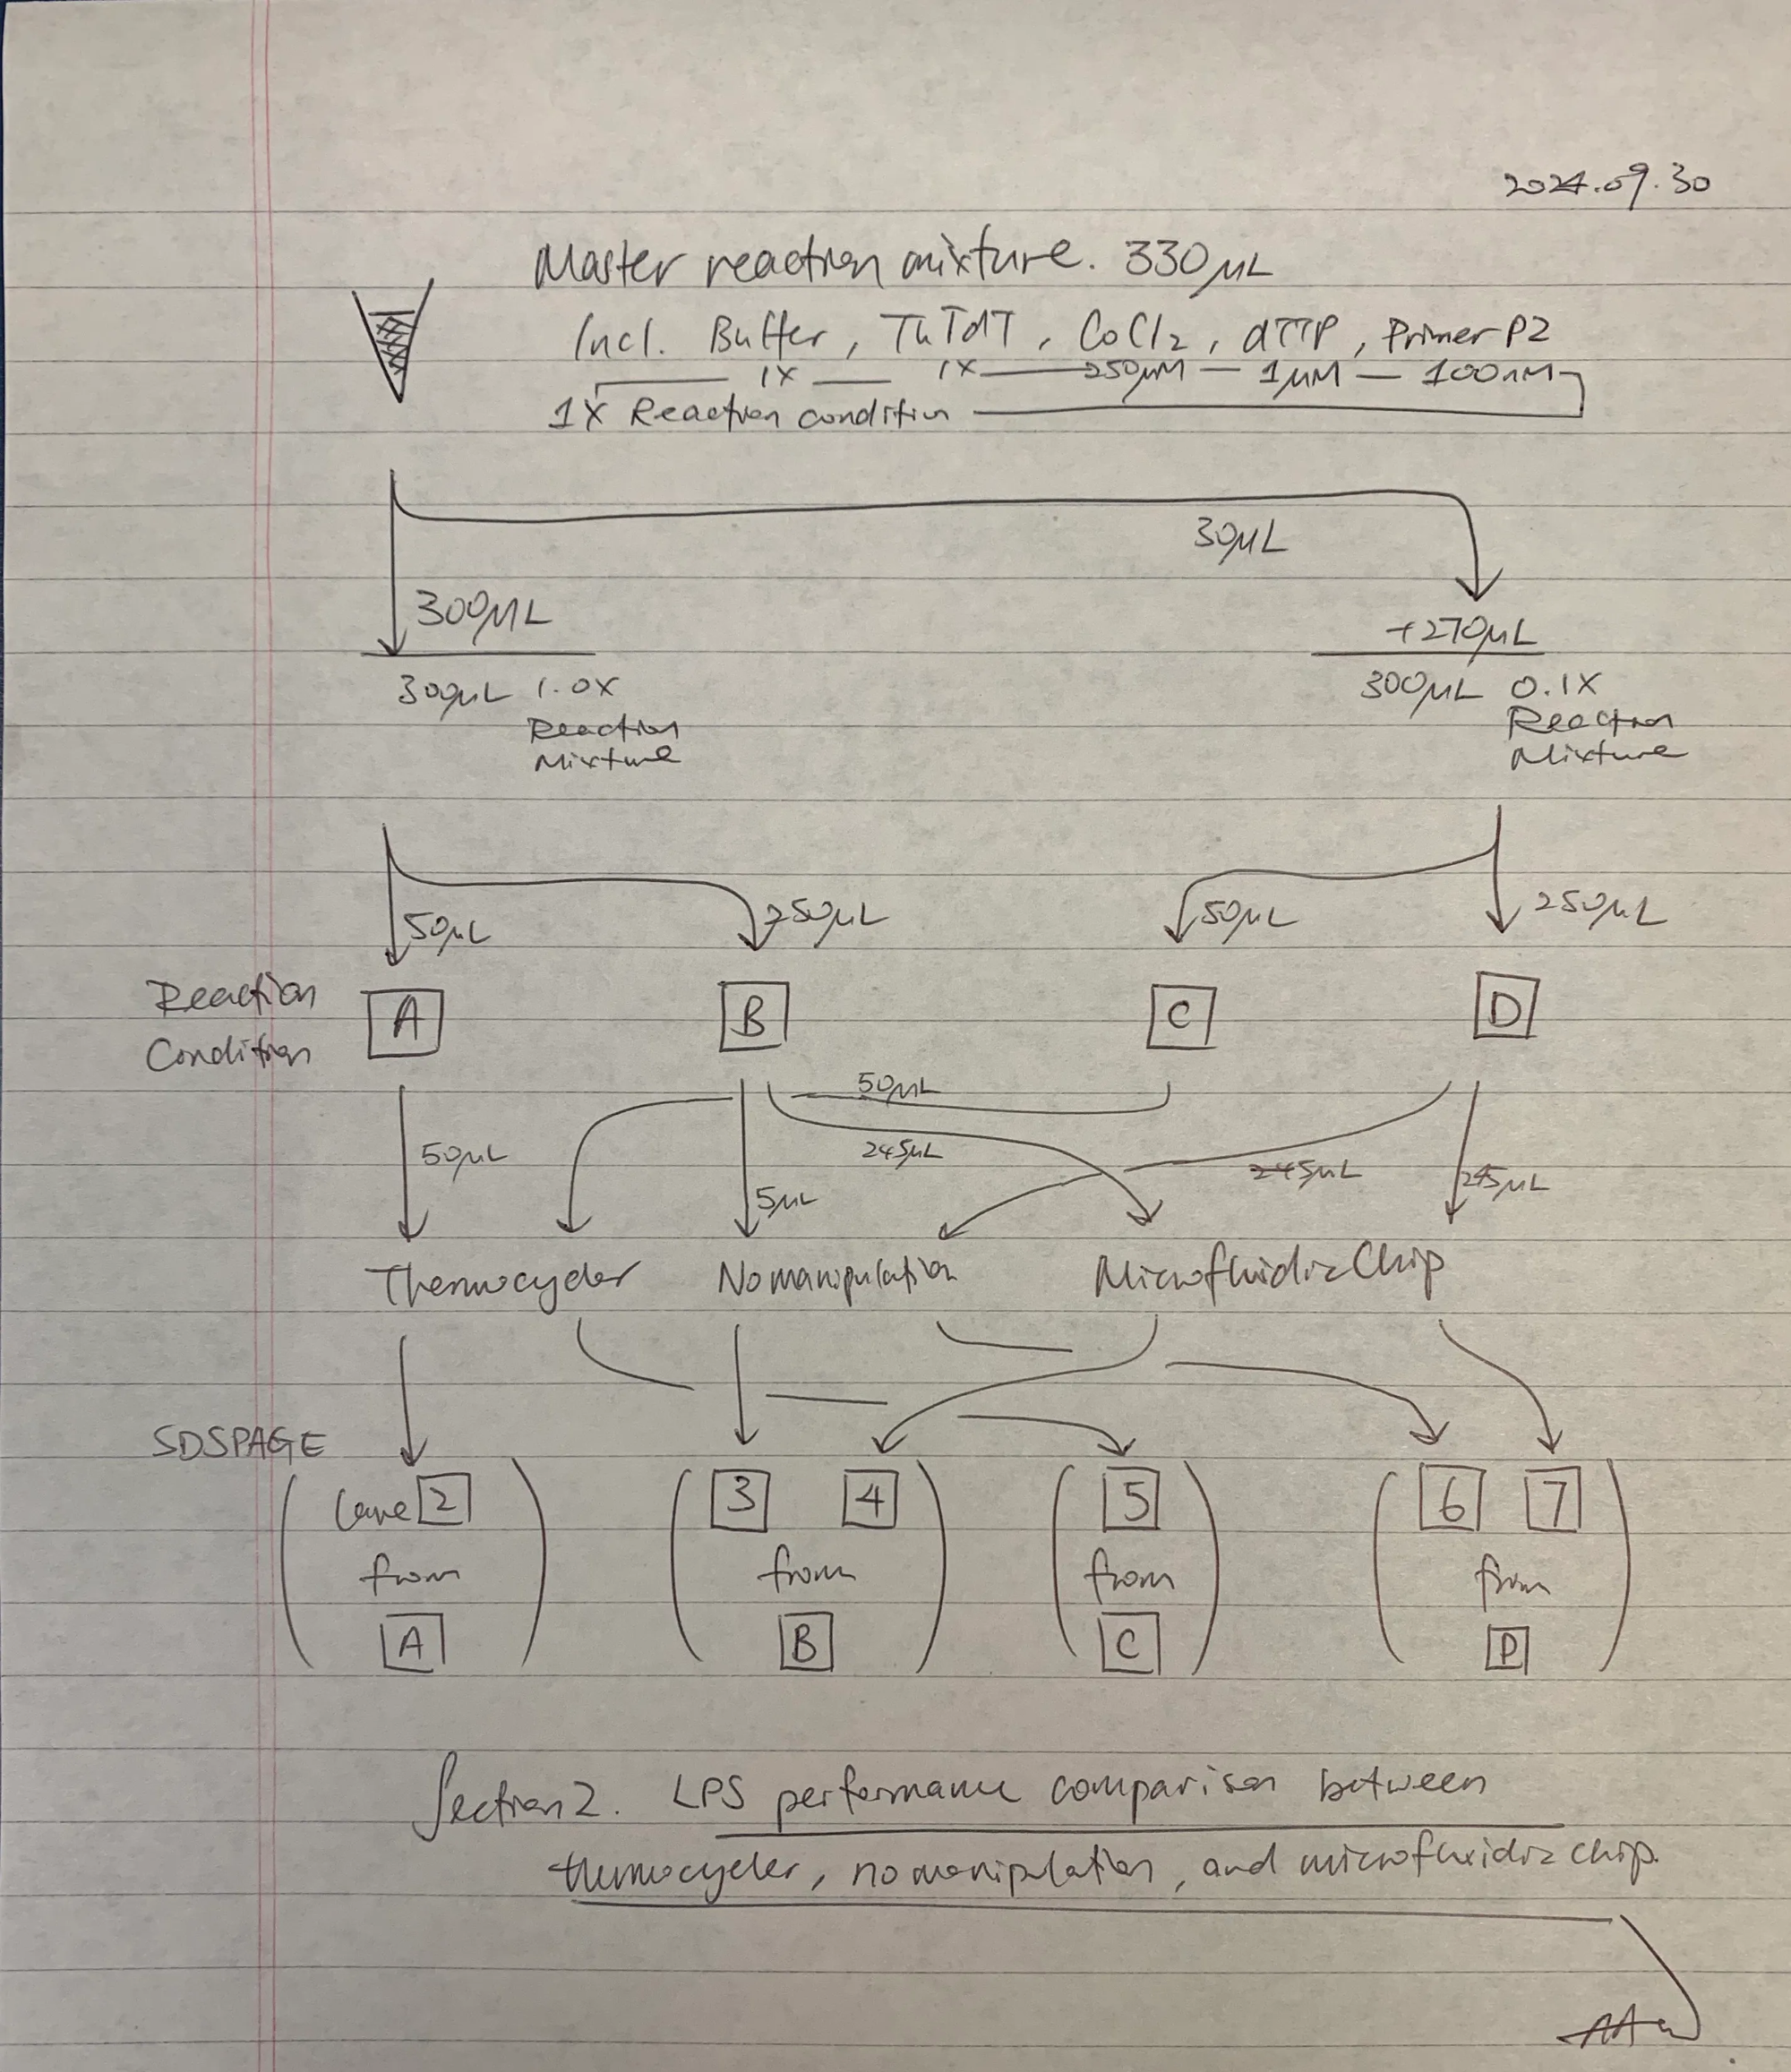
The following experimental plan tested the efficacy of LPS on the chip, such that a three-arm study is devised. The negative control was no manipulation (stored over ice, expecting no elongation activity); the positive control was 37ºC heating in a thermocycler; and the experimental intervention was 37ºC heating in a microfluidic chip.
Run 2 Learn
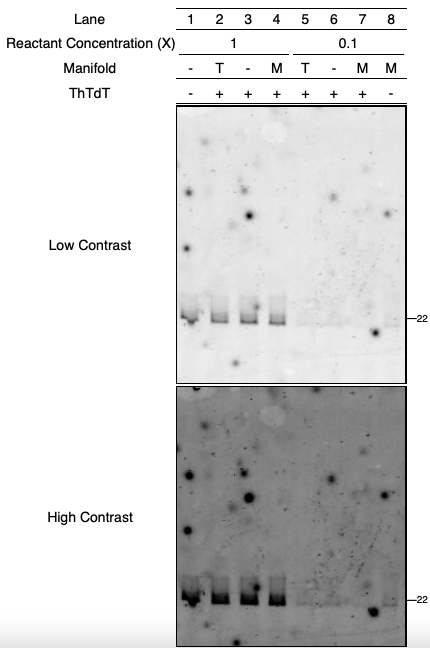
We learned that blocking the microfluidic chip with plasmids appears successful compared with the unblocked results in 2024.09.29 - Microfluidic Chip LPS Experiments.
Regretfully, ThTdT activity was not observed across all reaction manifolds. The efficacy of ThTdT in microfluidic chips remains inconclusive in this entry, and warrants future studies.
Future Directions with our Platform
Looking forward, we aim to continue refining our microfluidic platform to ensure its application in sustainable biomanufacturing processes. Upon sharing the results of our journey with our iHP contact Natalia Nayyar, we identified four key areas of progression that future work can target:

We hope our hardware efforts inspire the next generation of iGEM teams to give microfluidics a shot, and that our documentation helps them learn from our mistakes! Our team intends to release a comprehensive open-source toolkit with documentation and protocols, enabling other teams to easily reproduce and adapt our microfluidic system for their specific needs.
Citations and References
Battat, S., Weitz, D. A., & Whitesides, G. M. (2022). An outlook on microfluidics: The promise and the challenge. Lab on a Chip, 22(3), 53-536. https://doi.org/10.1039/d1lc00731a
Chambers, S. (2021, Jul. 15). Microfluidics Manufacturing: Converting Materials for Multilayer Microfluidics Devices. Strouse. https://www.strouse.com/blog/multilayer-microfluidics-manufacturing
Channon, R. B., Menger, R. F., Wang, W., Carrão, D. B., Vallabhuneni, S., Kota, A. K., & Henry, C. S. (2021). Design and application of a self-pumping microfluidic staggered herringbone mixer. Microfluidics and Nanofluidics, 25(4). https://doi.org/10.1007/s10404-021-02426-x
Cortes-Quiroz, C. A., Azarbadegan, A., Moeendarbary, E. (2010). An efficient passive planar micromixer with finshaped baffles in the tee channel for wide Reynolds number flow range. World Academy of Science, Engineering and Technology, 4, 32-37.
Hong, H. & Yeom, E. (2022). Numerical and experimental analysis of effective passive mixing via a 3D serpentine channel. Chemical Engineering Science, 261, 117972. https://doi.org/10.1016/j.ces.2022.117972
Husain, A., Khan, F. A., Huda, N., & Ansari, M. A. (2018). Mixing performance of split-and-recombine micromixer with offset inlets. Microsystem Technologies : Sensors, Actuators, Systems Integration, 24(3), 1511-1523. https://doi.org/10.1007/s00542-017-3516-4
Kim, D. S., Lee, S. H., Kwon, T. H., & Ahn, C. H. (2005). A serpentine laminating micromixer combining splitting/recombination and advection. Lab on a Chip, 5(7), 739-747. https://doi.org/10.1039/b418314b
Natsuhara, D., Saito, R., Okamoto, S., Nagai, M., & Shibata, T. (2022). Mixing performance of a planar asymmetric contraction-and-expansion micromixer. Micromachines, 13(9), 1386. https://doi.org/10.3390/mi13091386
Pattanayak, P., Singh, S. K., Gulati, M., Vishwas, S., Kapoor, B., Chellappan, D. K., Anand, K., Gupta, G., Jha, N. K., Gupta, P. K., Prasher, P., Dua, K., Dureja, H., Kumar, D., & Kumar, V. (2021). Microfluidic chips: Recent advances, critical strategies in design, applications and future perspectives. Microfluidics and Nanofluidics, 25(12), 99-99. https://doi.org/10.1007/s10404-021-02502-2
Suh, Y. K., & Kang, S. (2010). A review on mixing in microfluidics. Micromachines, 1(3), 82-111. https://doi.org/10.3390/mi1030082
Viktorov, V., Mahmud, M. R., & Visconte, C. (2016). Numerical study of fluid mixing at different inlet flow-rate ratios in tear-drop and chain micromixers compared to a new H-C passive micromixer. Engineering Applications of Computational Fluid Mechanics, 10(1), 182-192. https://doi.org/10.1080/19942060.2016.1140075
Wang, X., Liu, Z., Wang, B., Cai, Y., & Song, Q. (2023). An overview on state-of-art of micromixer designs, characteristics and applications. Analytica Chimica Acta, 1279, 341685. https://doi.org/10.1016/j.aca.2023.341685
What is Computational Fluid Dynamics (CFD)? Ansys. https://www.ansys.com/simulation-topics/what-is-computational-fluid-dynamics#how-work
Whitesides, G. M. (2006). The origins and the future of microfluidics. Nature (London), 442(7101), 368-373. https://doi.org/10.1038/nature05058
Xia, H. M., Wan, S. Y. M., Shu, C., & Chew, Y. T. (2005). Chaotic micromixers using two-layer crossing channels to exhibit fast mixing at low reynolds numbers. Lab on a Chip, 5(7), 748-755. https://doi.org/10.1039/b502031j
Yin, B., Yue, W., Sohan, A. S. M. Muhtasim Fuad, Zhou, T., Qian, C., & Wan, X. (2021). Micromixer with fine-tuned mathematical spiral structures. ACS Omega, 6(45), 30779-30789. https://doi.org/10.1021/acsomega.1c05024
Wu, Z., & Chen, X. (2019). A novel design for passive micromixer based on cantor fractal structure. Microsystem Technologies : Sensors, Actuators, Systems Integration, 25(3), 985-996. https://doi.org/10.1007/s00542-018-4027-7
