Introduction
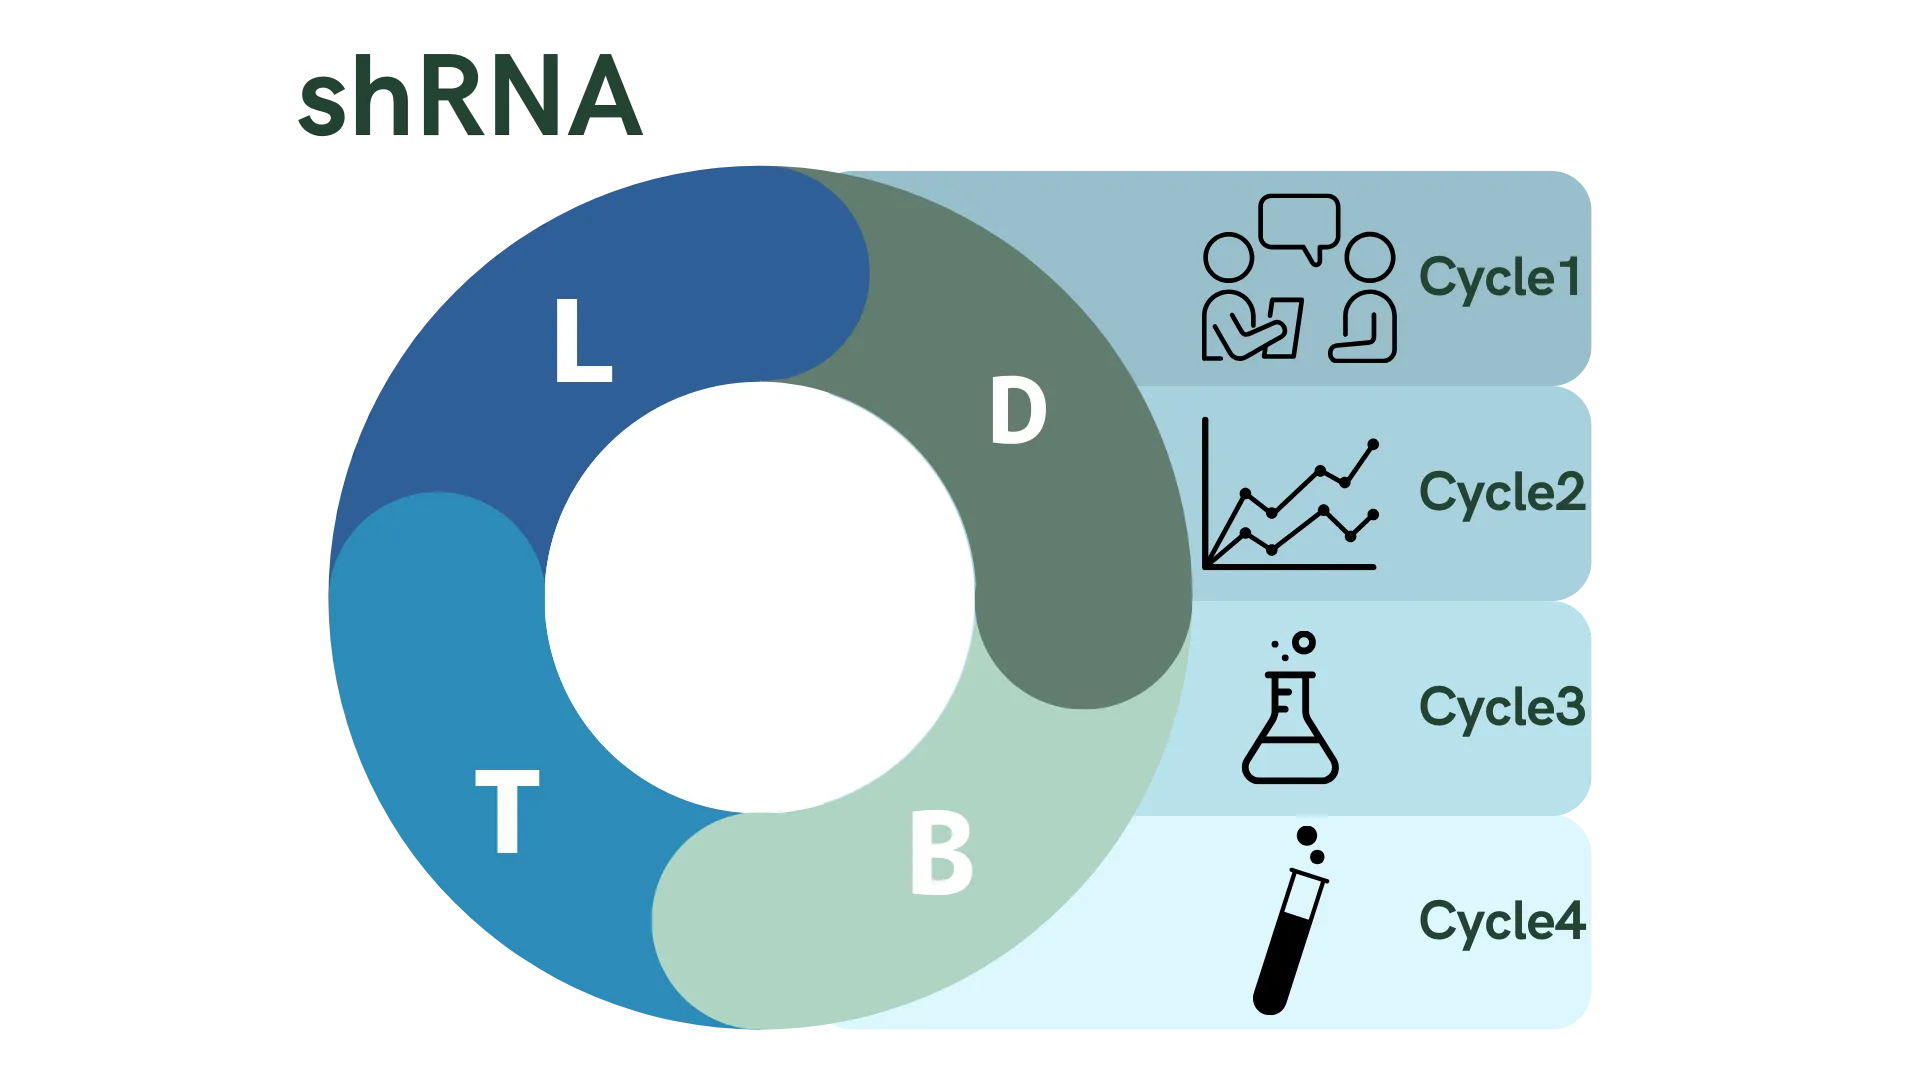
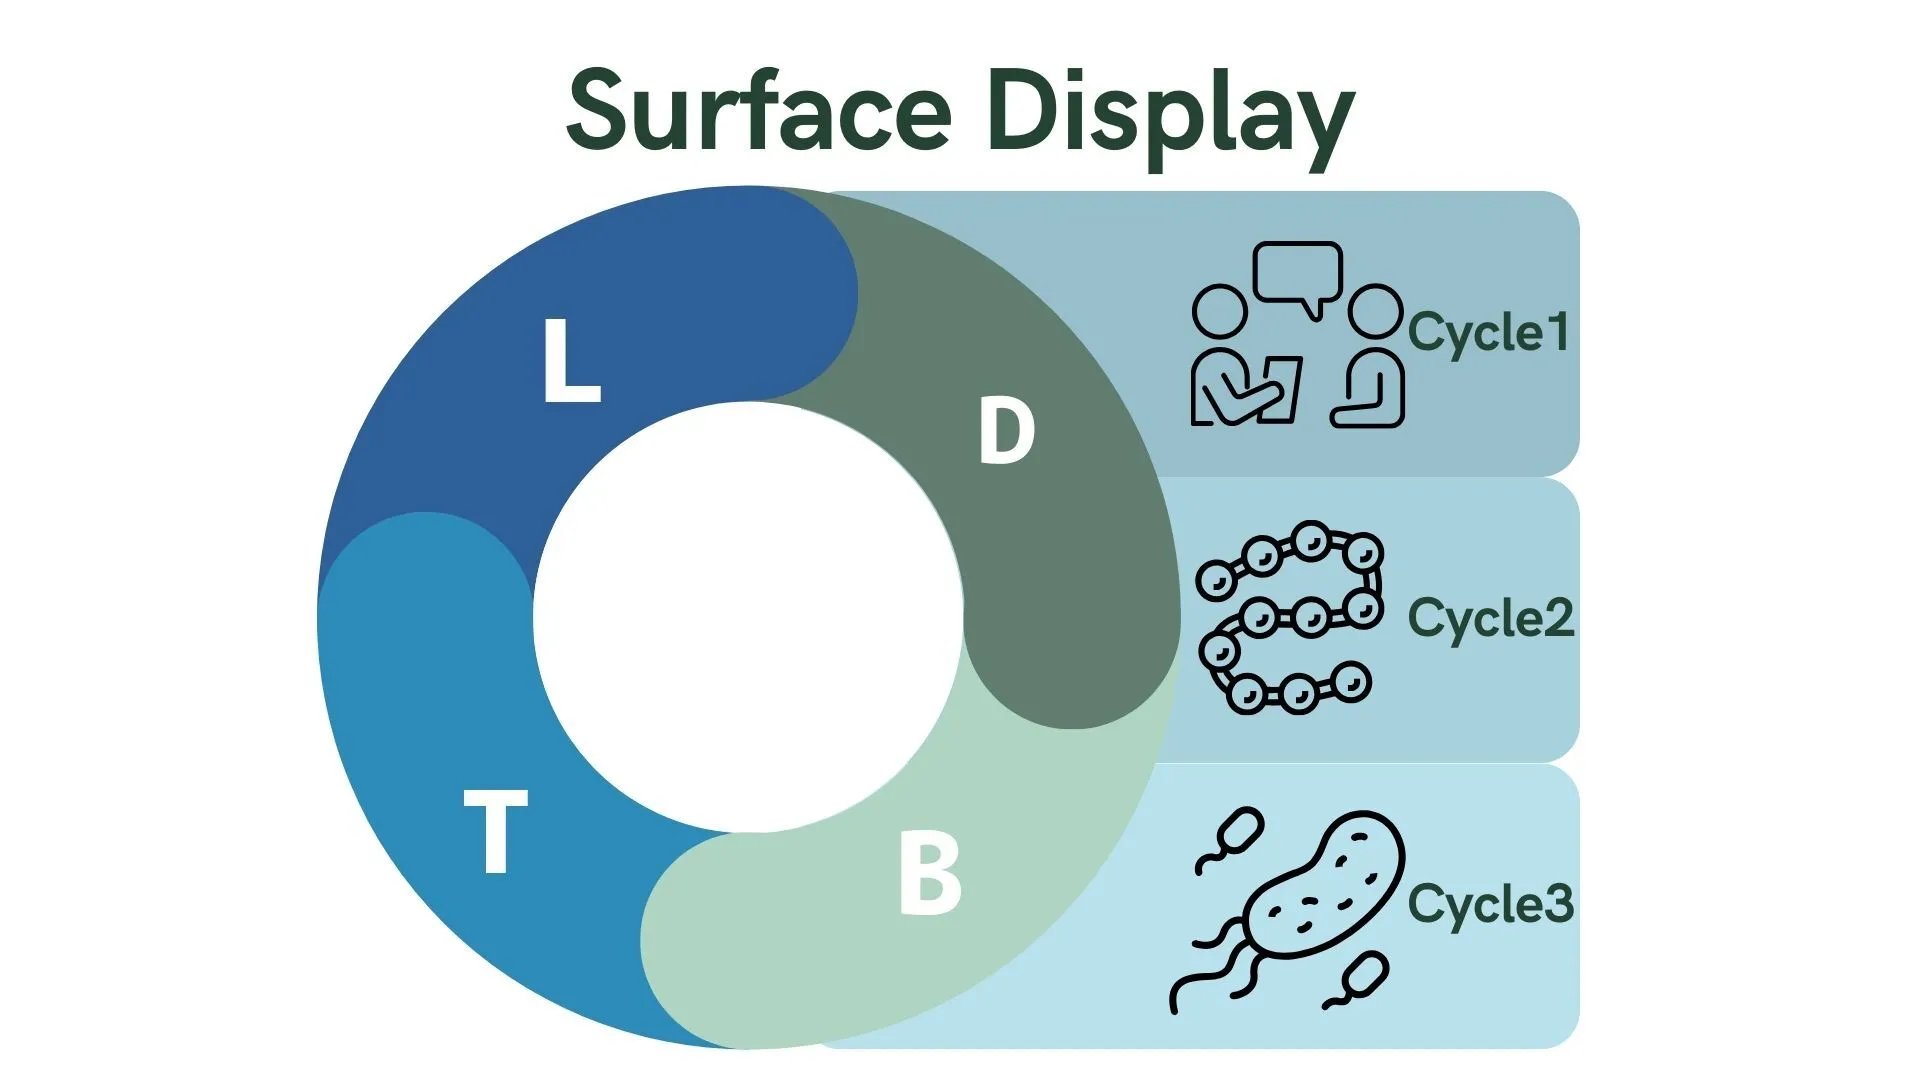
To realize this project, we tackled challenges through a more engineering-oriented process. Here, we adopt the DBTL cycle, which aims to solve problems through four aspects: Design, Build, Test, and Learn.
On this page, we introduce how we are actually implementing the DBTL cycle throughout the project progress, along with how we are improving our project.
Encapsulation of shRNA
Cycle 1
Design
While RNA pesticides are mentioned as potentially useful pesticides in the future, there are still challenges to their practical application. One of these problems is the short duration of RNA effectiveness [1] .
To overcome this issue, we considered a method of encapsulating RNA with membrane vesicles (MVs) to protect it from external influences and retain the RNA for a longer period [2] .
Build
We focused on a method of actively producing MVs and encapsulating RNA in MVs by producing poly(3-hydroxybutyrate) (PHB) in Escherichia coli to release multi-layered membrane vesicles (m-MVs) [3] . (For more details, see the Design page )
Therefore, to evaluate the validity of this method, we conducted interviews with experts.
Test
We interviewed MVs researchers about our proposed method. (For more details, see Integrated Human Practices )
Learn
We learned that while it is possible to encapsulate RNA in MVs using this method, it is necessary to increase the probability of RNA being encapsulated in MVs by implementing techniques such as increasing RNA concentration.
We also learned that measures are needed to make MVs more efficiently taken up by the target. We discovered that one such method is to display functional proteins on the outer membrane of E. coli.
Cycle 2
Design
In our project, we create protected shRNA by incorporating it into m-MVs. At this point, there must be at least one shRNA inside each m-MV. Empty m-MVs could potentially reduce the effectiveness of the pesticide. Due to time and cost constraints in wet lab experiments, we conduct simulations in advance to determine if MOVE production is possible, thereby increasing the certainty of our experiments.
Build
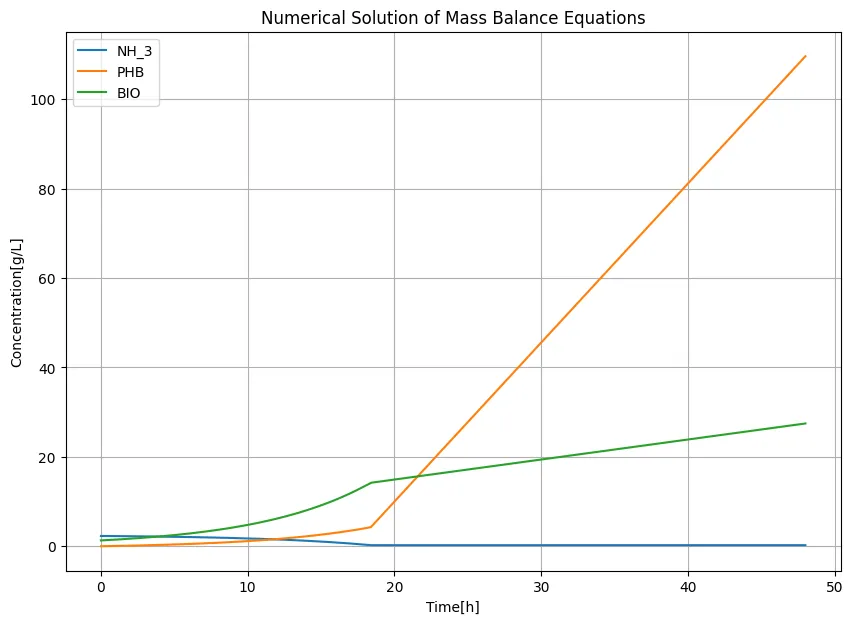
We calculate the shRNA production and m-MV production per individual E. coli cell to confirm if shRNA incorporation into m-MVs is possible under conditions similar to previous research [1] . The cultivation conditions we will use in our wet lab are as follows:
Initial BIO amount: 1.3g
Initial nitrogen content in LB medium: 2.3g (typical content in 100mL of LB)
Culture time: 48 hours
Test
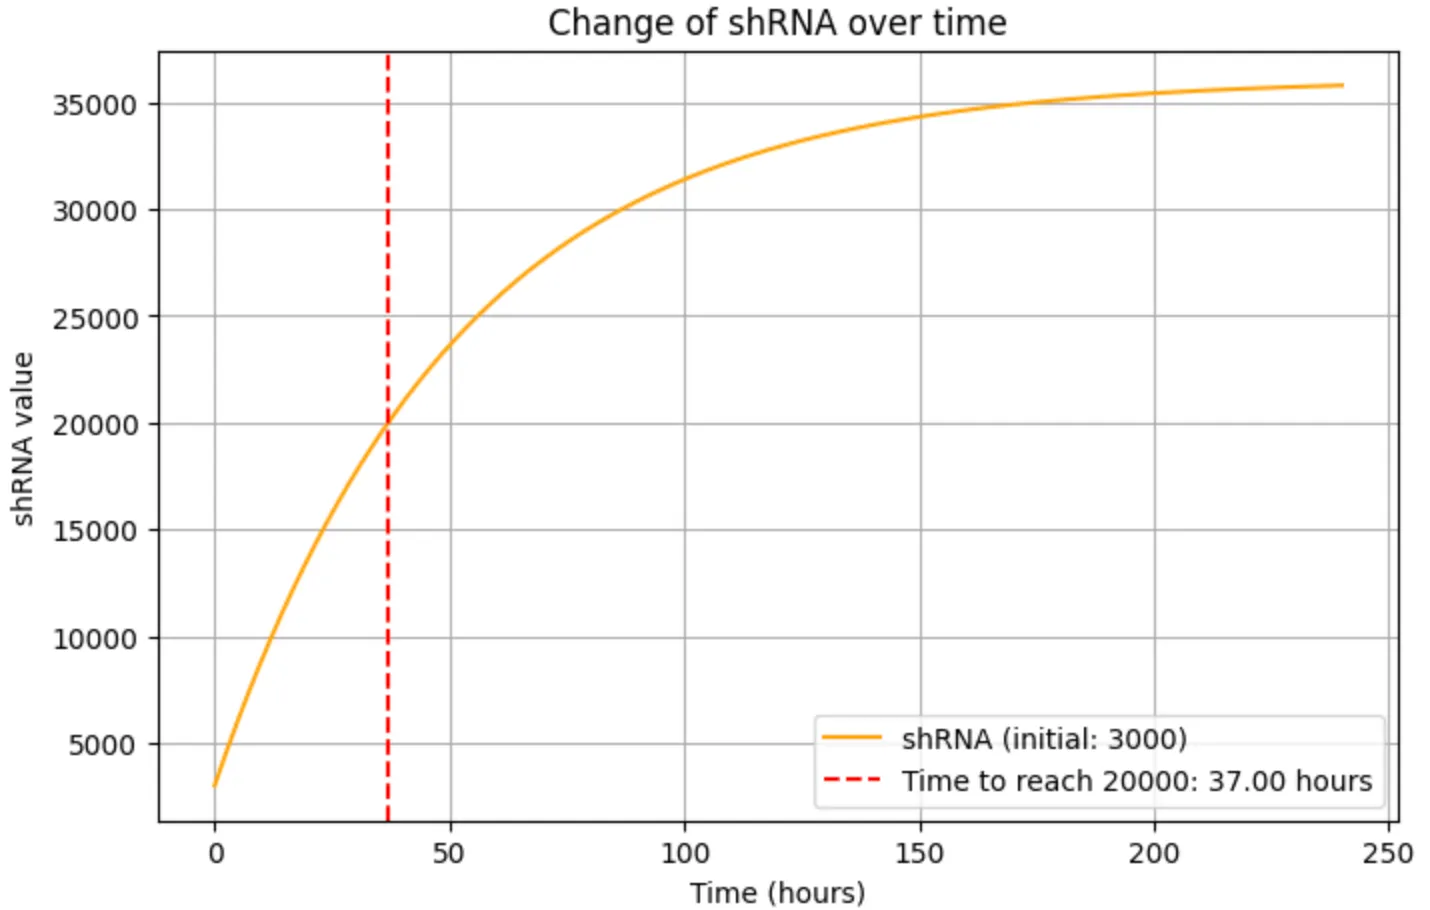
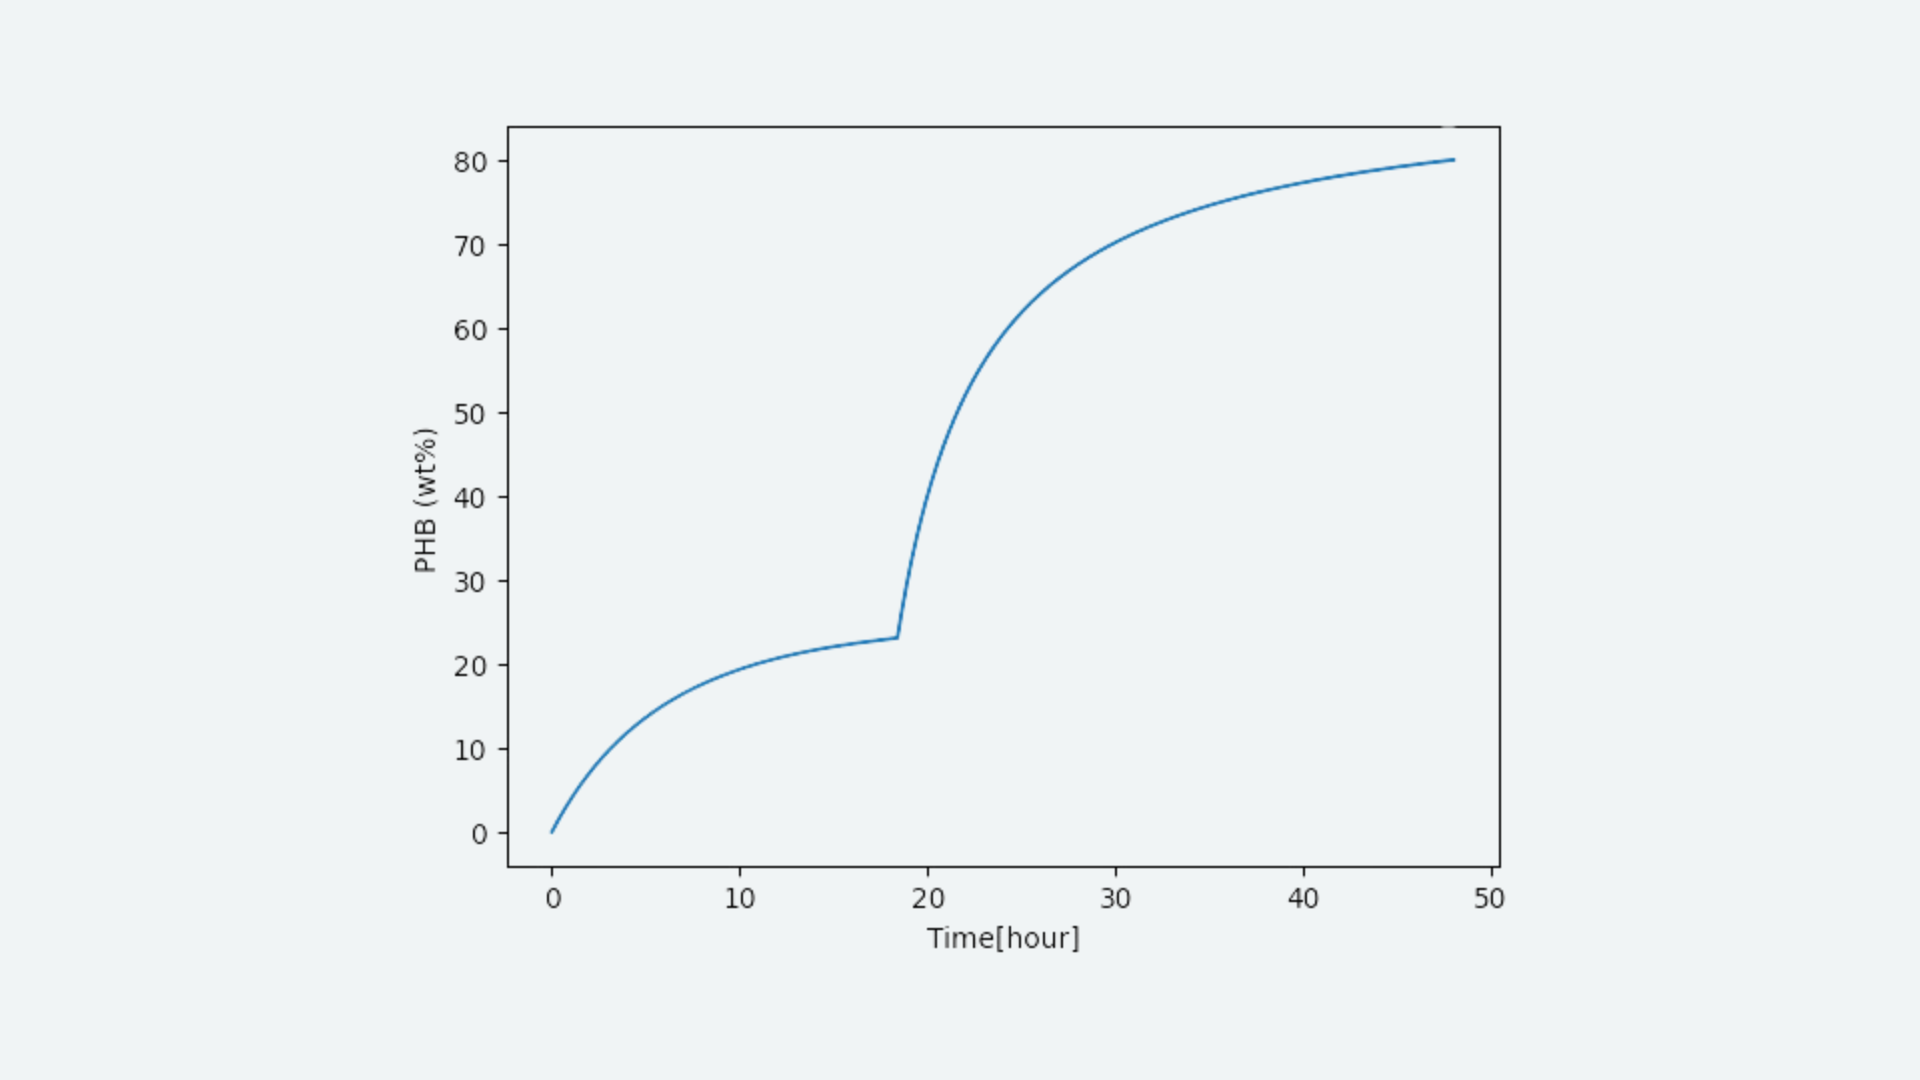
Through modeling, it was estimated that the amount of shRNA per bacterial cell is 540 per hour. This allowed us to simulate the number of shRNA within the cells, and combined with the m-MV production model, we considered estimating the amount of shRNA in m-MVs. When PHB (wt%) is 80wt%, an average of 0.375 m-MVs are produced per bacterial cell. (For more details, see Dry Lab )
Learn
Analysis of these results revealed that our transformants are divided into growth phase and m-MV production phase depending on the nitrogen content. This is an important discovery for efficient production of m-MVs. Additionally, we found that shRNA is sufficiently produced within the cells even under the cultivation conditions from previous studies, and that an average of about 4 shRNAs are likely to be encapsulated in each m-MV. This indicates that MOVE can potentially be created in the Wet lab, giving rise to hope for experimental success.
Cycle 3
Design
Based on the results from the Dry Lab, we attempted to produce MVs using the Polymer Intracellular Accumulation-triggered system for Membrane Vesicle Production (PIA-MVP)[3] in the Wet Lab. To begin with, we focused on cultivating E. coli under appropriate conditions.
Build
Glucose concentration is said to be an important factor in PIA-MVP, so we prepared media with different glucose concentrations to cultivate E. coli. For cultivation, we used 50 mL centrifuge tubes containing 20 mL of LB medium. The growth of E. coli and PHB production were monitored by OD600 measurements and fluorescence microscopy observations, respectively.
Test
The E. coli we were culturing did not grow as much as we had expected, and the PHB production was less than expected.
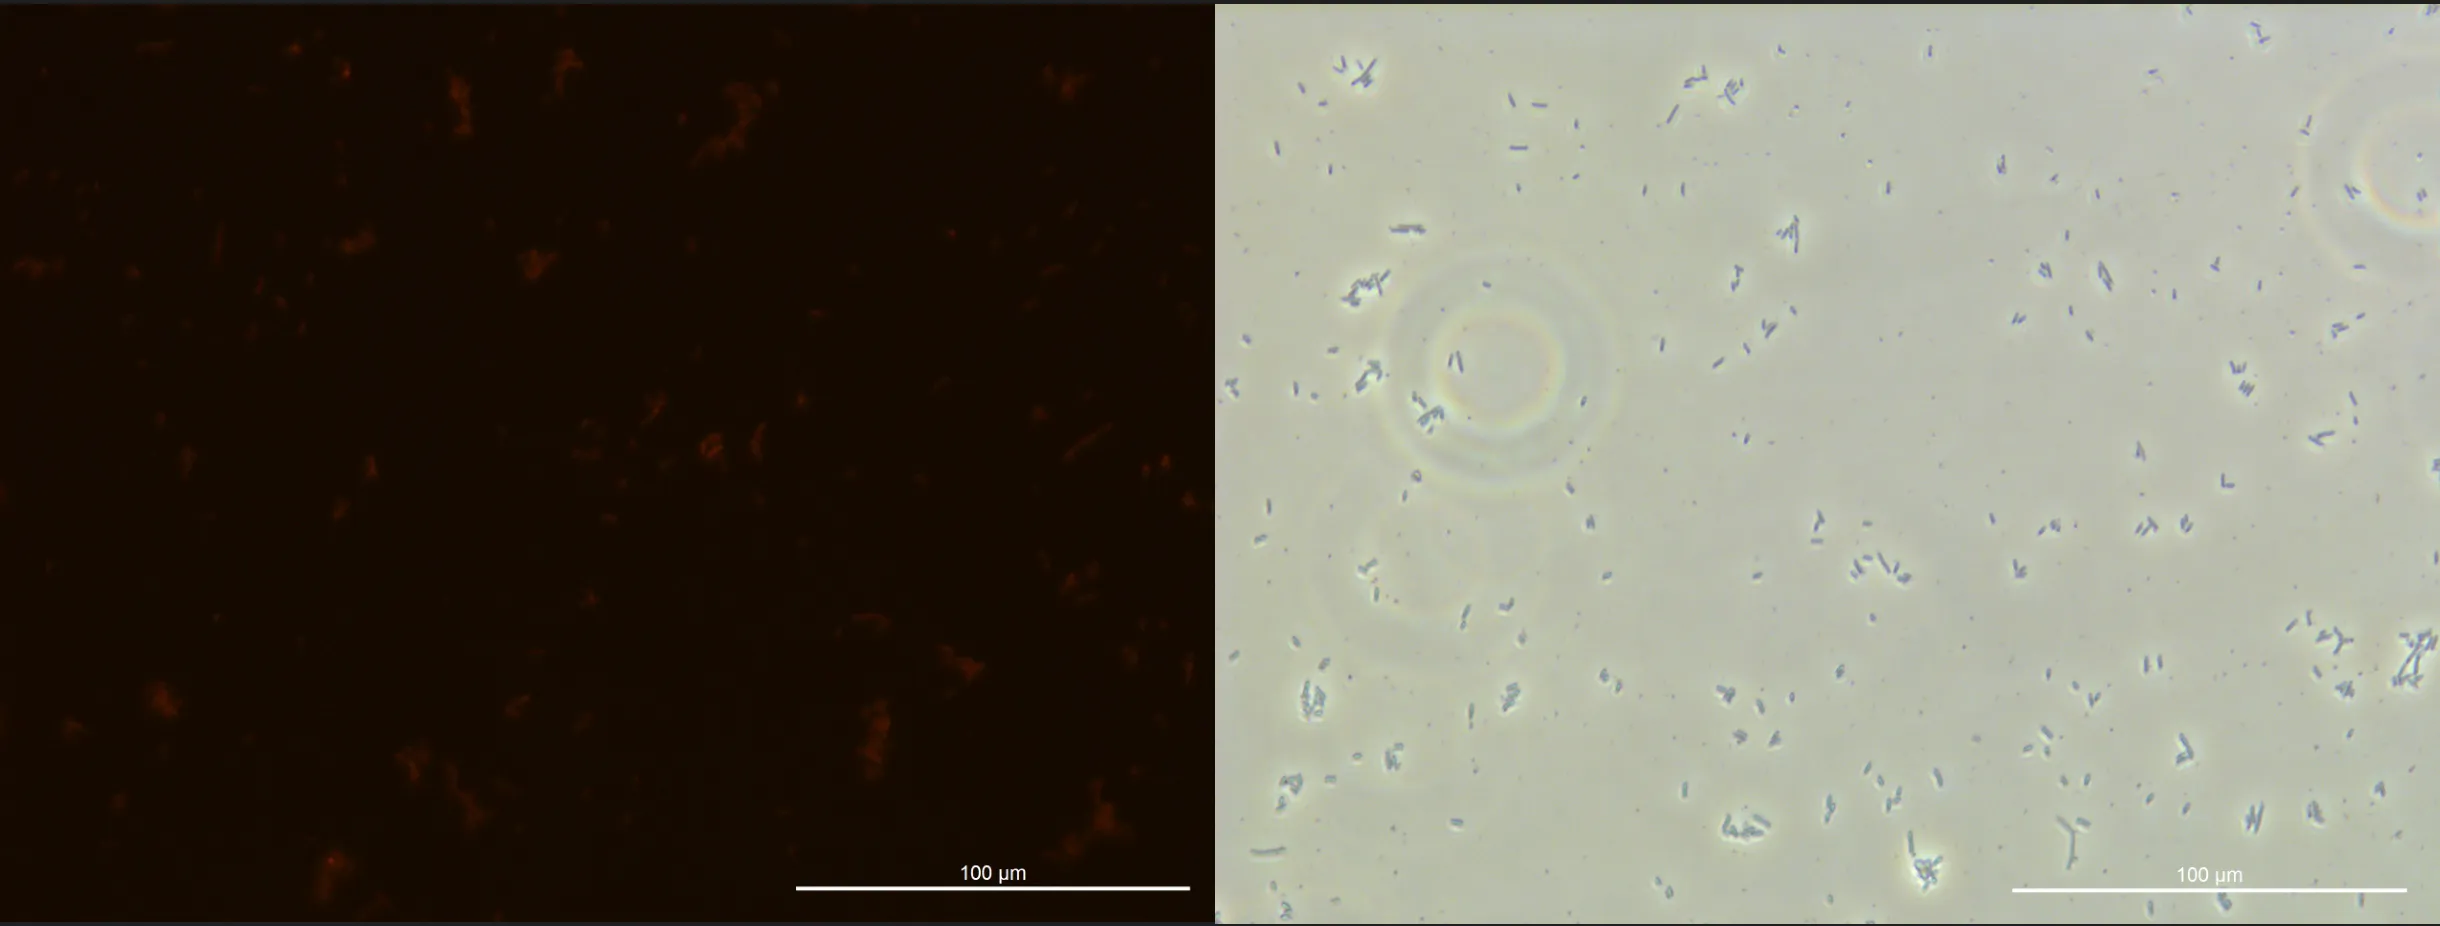
MVs collection was suspended based on these results.
Learn
We concluded that there were issues with the cultivation method. Specifically, we determined that the points to be improved were: insufficient agitation of the medium during cultivation, resulting in inadequate nutrient distribution; and the use of centrifuge tubes, which led to poor aeration, limiting the amount of PHB produced under aerobic conditions, which is typically produced in larger quantities.
Cycle 4
Design
We considered cultivation conditions that would allow E. coli to proliferate more easily and produce PHB. Specifically, we used 2position cap tubes instead of centrifuge tubes and covered them with polypropylene caps. We expected this to improve aeration and promote PHB production. Furthermore, we cultured 3 mL of LB medium in 10 mL test tubes, anticipating that this would allow for better agitation of the medium.
Build
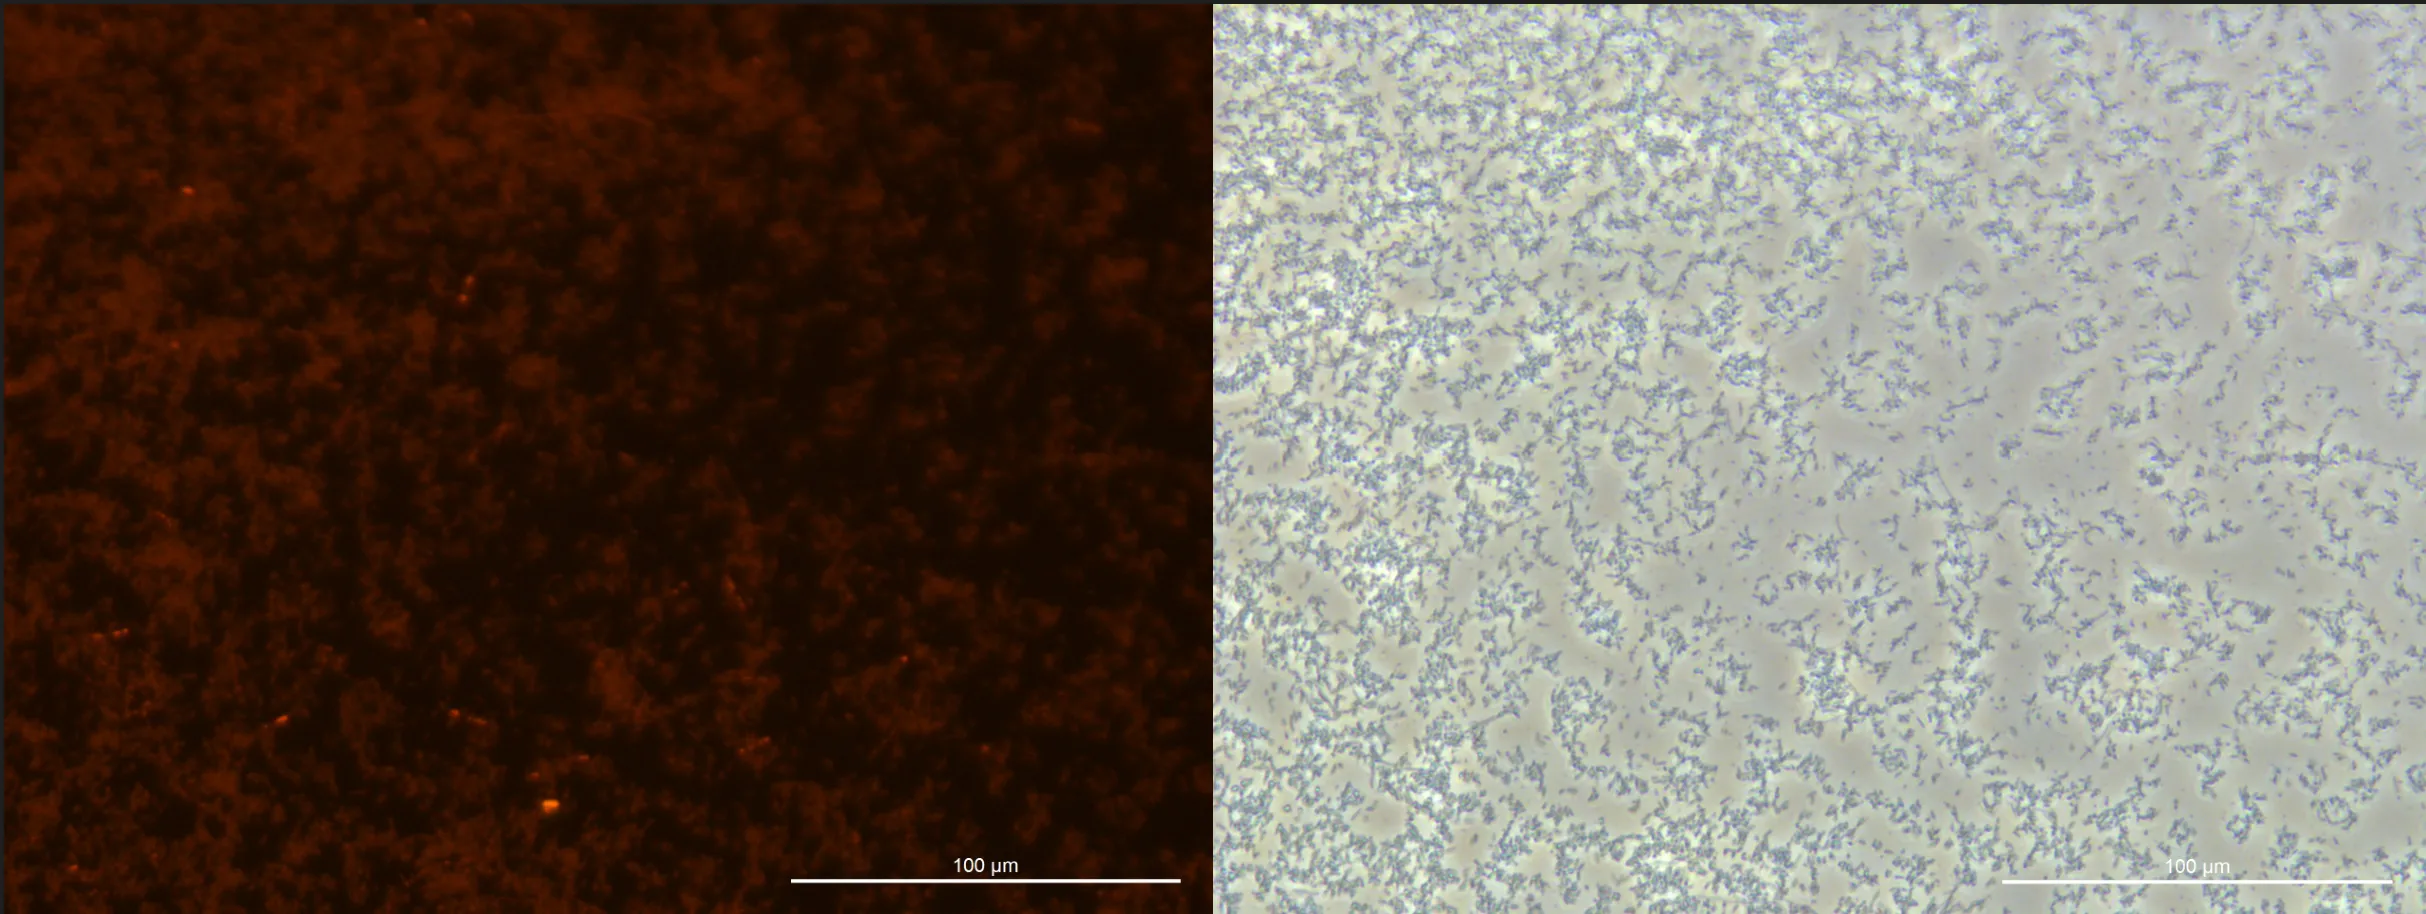
We observed and compared the cultivation as in the previous cycle to confirm the state of cultivation.
Test
We confirmed that compared to the previous cycle, there was greater proliferation of E. coli and increased production of PHB.
Learn
We found that the cultivation results varied significantly depending on the cultivation conditions for E. coli. Through this experience, we learned the importance of considering cultivation methods for each bacterial strain and required situation, enabling us to apply this knowledge to future steps.
Surface Display
Cycle 1
Design
Plants, pathogens, or insect pests were considered as candidates for MV uptake, but we first attempted to enter plants. Specifically, we considered displaying proteins on the outer membrane of E. coli with the aim of mimicking the means by which pathogens enter plants.
Build
Using the rice blast pathogen P. oryzae as an invasion model, we proposed cuticle and cell wall degrading enzymes used by P. oryzae as candidates for surface-displayed proteins[5] .
We then interviewed experts to determine if these ideas and candidates were appropriate.
Test
We interviewed researchers studying RNA pesticides about our proposed method. (For more details, see integrated human practice )
Learn
We realized that introducing MVs by damaging plants could also facilitate the entry of pathogens, which could be rather dangerous for the plants. Therefore, we learned that we need to search for proteins to display on the surface that would allow the pathogen itself, rather than the plant, to take up the MVs.
Cycle 2
Design
As a result of the interviews, we learned that introducing MOVE into plants is not a good approach. Therefore, we now consider pathogens as the target for MOVE uptake. We believed that the cell wall on the surface of pathogens would be a major factor inhibiting the uptake of MOVE. To increase the probability of pathogens taking up MOVE, we revised the types of enzymes to be surface-displayed and attempted to display new proteins on the surface.
Build
The proteins we attempted to display on the surface include those that break down components of the pathogen’s cell wall such as chitin and glucan[6] [7] , and those that assist in adhering to the plant leaf surface[8] .
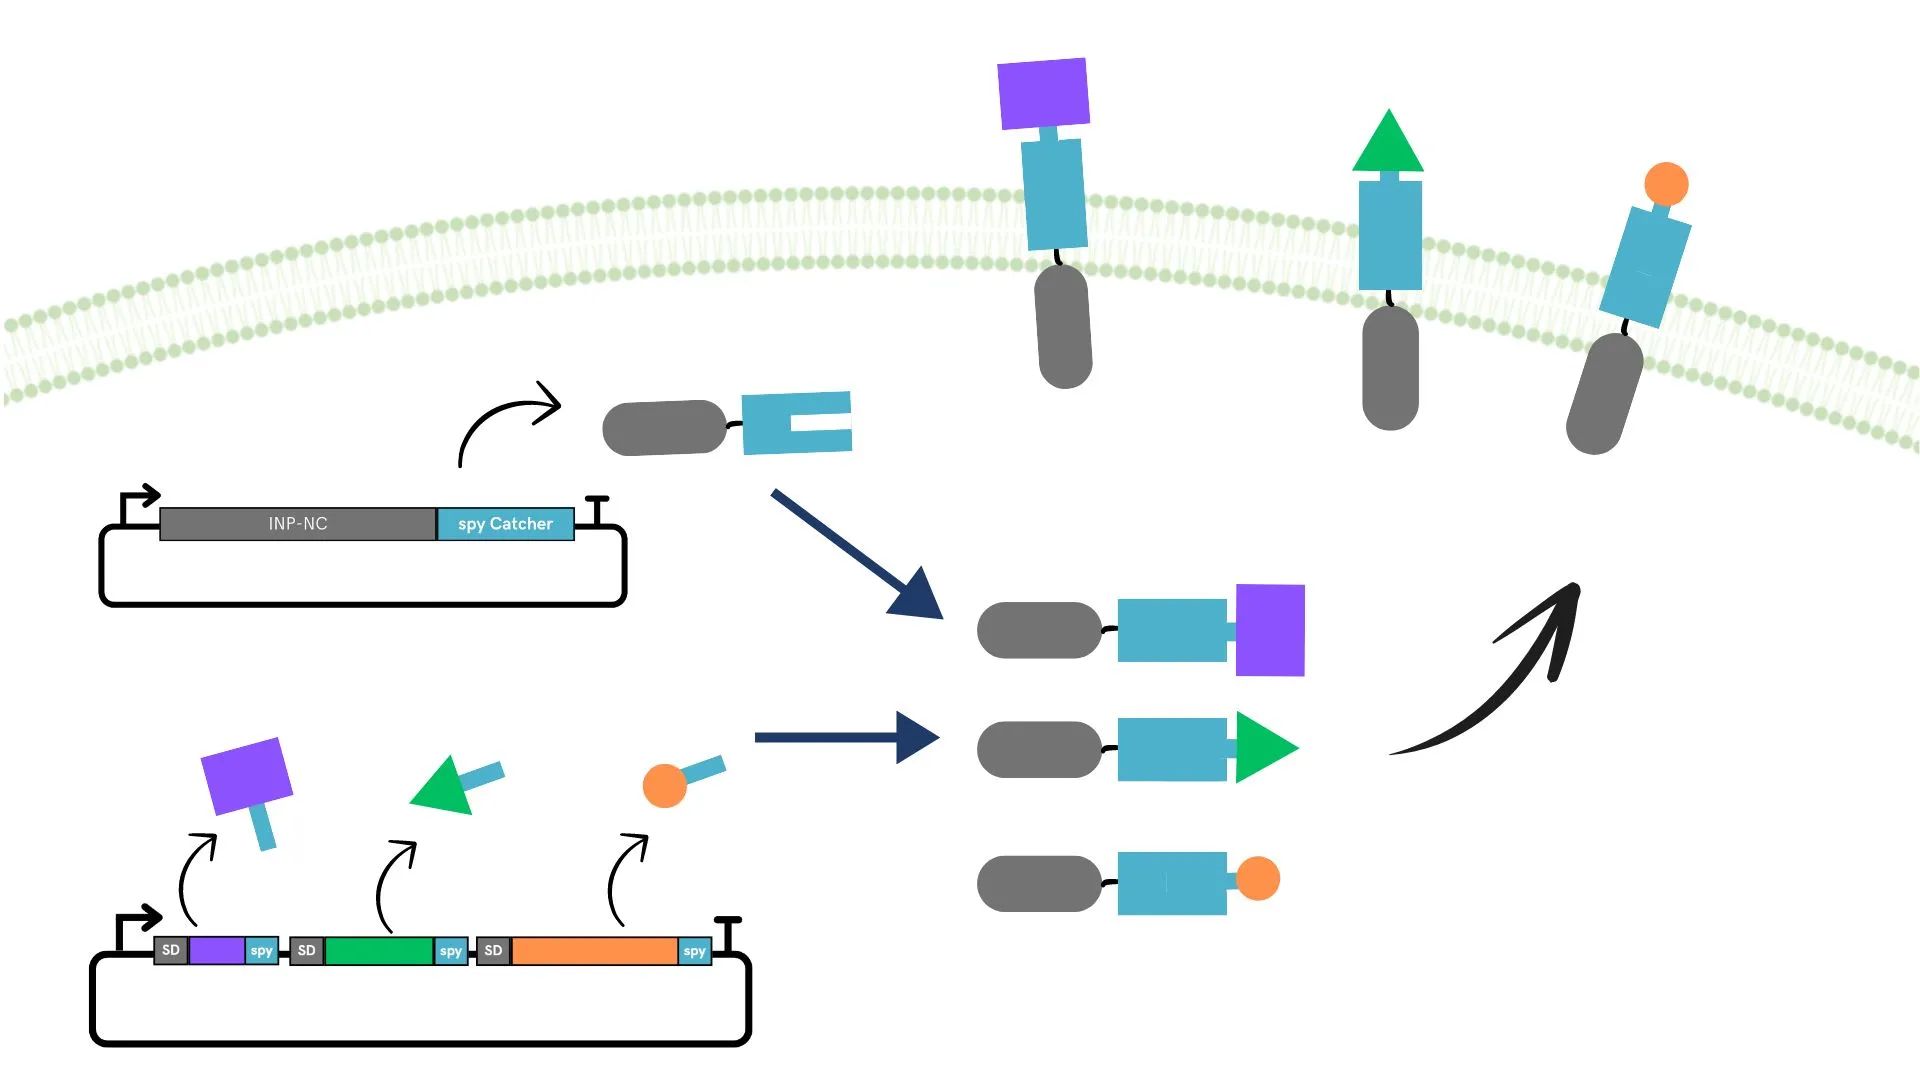
We adopted the SpyCatcher-SpyTag system[9] to display multiple different enzymes on the surface. In this method, by incorporating the SpyTag sequence into the sequence encoding the functional protein, and simultaneously expressing a scaffold protein with an incorporated SpyCatcher sequence prepared separately, it is theoretically possible to display multiple enzymes on the surface.
When using the SpyCatcher-SpyTag for surface display, it is necessary to confirm that the active site of the displayed enzyme is not inhibited by the surface display. Here, to reduce the burden on the Wet lab, we used AlphaFold and OPM in the Dry Lab to confirm in advance that substrate binding is maintained after surface display.
Test
We present the results from AlphaFold and OPM
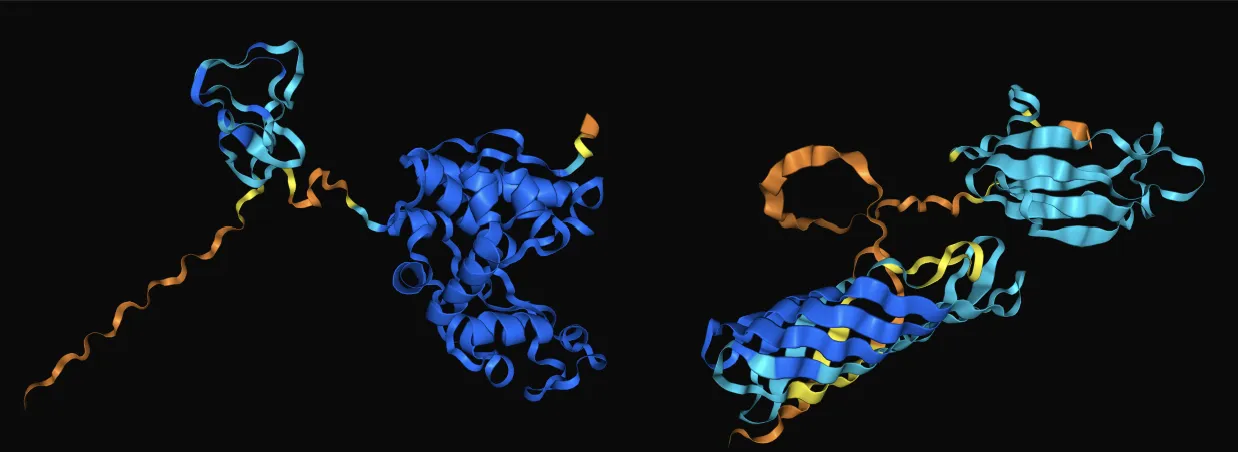

AlphaFold shows that the active site of the enzyme is not inhibited in the fused protein, and OPM demonstrates that the protein is successfully displayed on the surface of MOVE, with the enzyme portion particularly exposed on the membrane surface.
Learn
From the results of AlphaFold and OPM, we found that a sequence with a well-extended flexible linker on the SpyCatcher side can likely exhibit sufficient activity on the surface without losing substrate binding ability. This ensures the reliability of experiments in the Wet lab.
Cycle 3
Design
We attempted to evaluate proteins displayed on the outer membrane by actually creating plasmids containing genes that express proteins validated by models in the Dry Lab.
Build
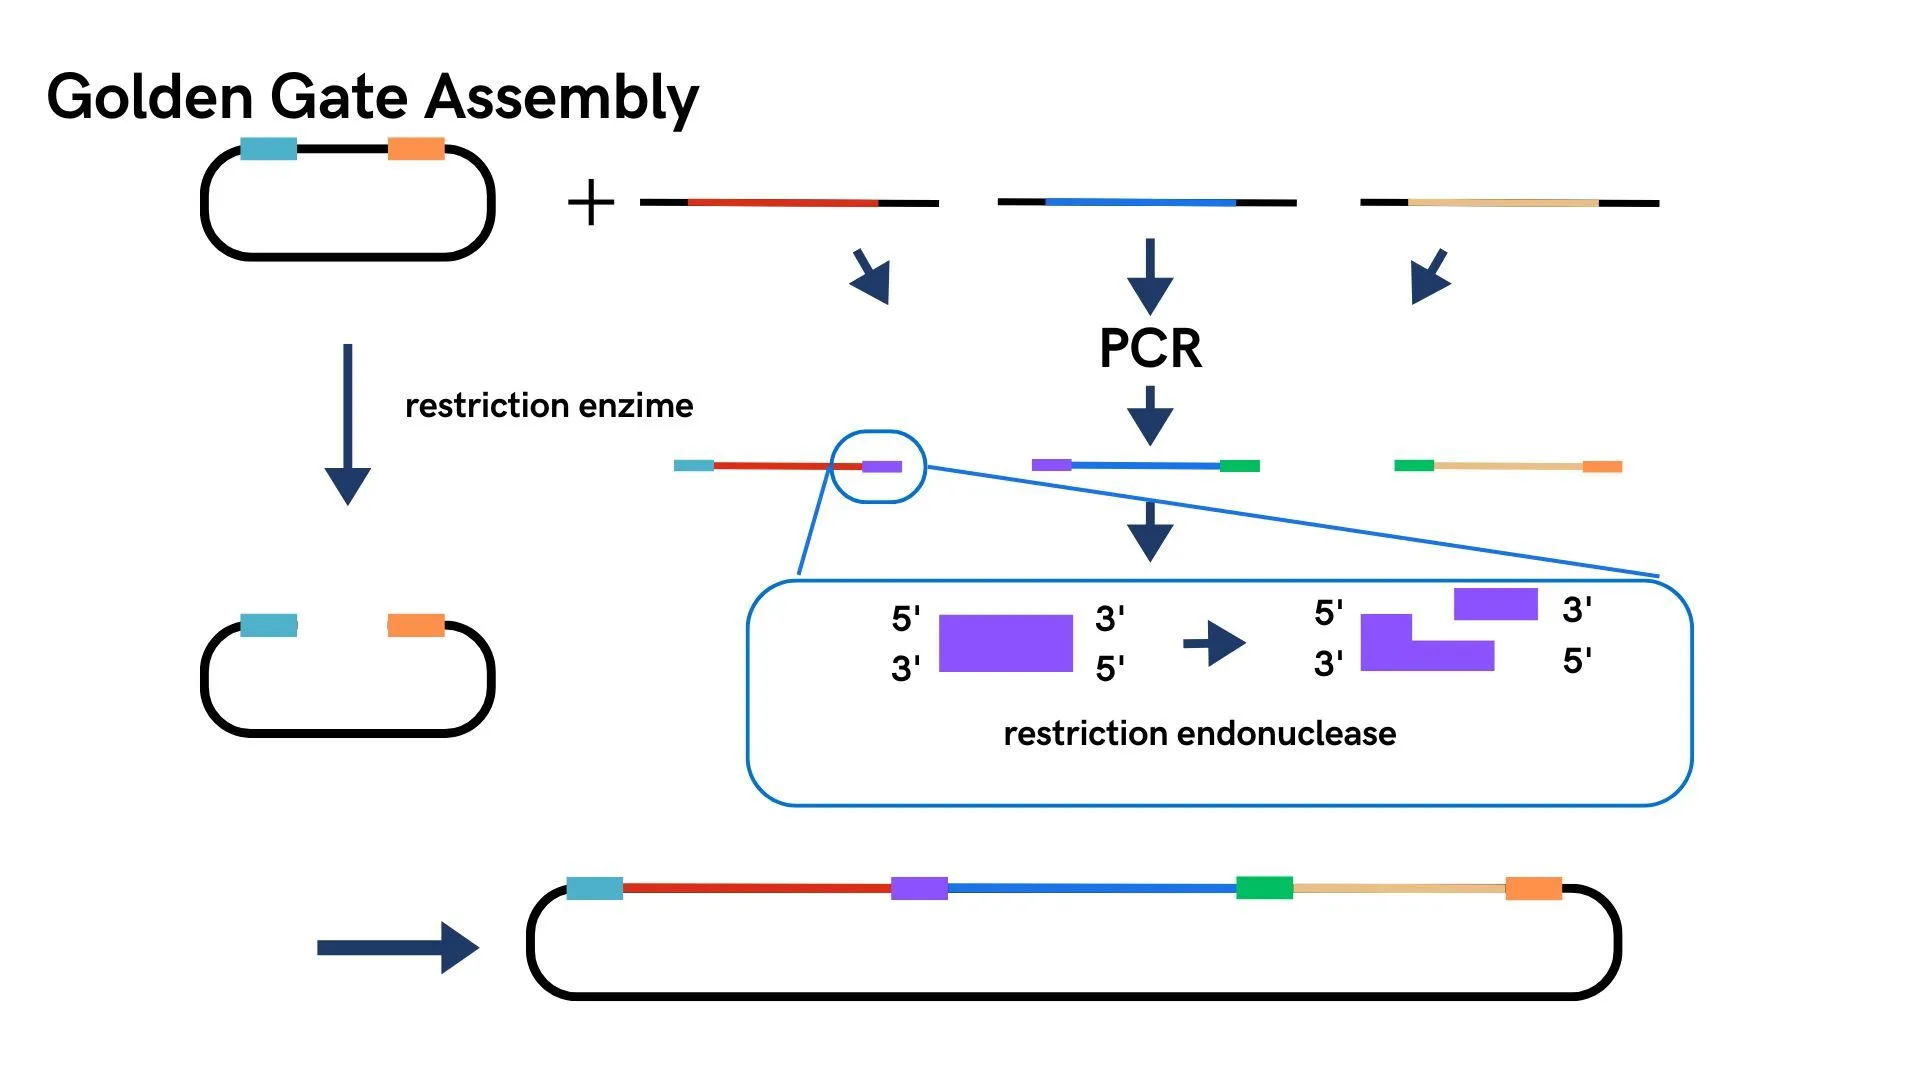
The plasmids created here can be broadly classified into two types. One is a plasmid encoding a fusion protein of the scaffold protein and SpyCatcher, and the other is a plasmid encoding a fusion protein of the functional protein to be displayed on the E. coli surface and SpyTag.
Chloramphenicol and ampicillin were used as selection markers.
Two types of plasmids were transformed into the same E. coli and cultured. The membrane of the cultured E. coli was disrupted, and only the membrane fraction was collected. Quantification was performed using SDS-PAGE and Western blotting.
Test
When we amplified the actually constructed plasmids using specific primers, bands were confirmed at the target positions. After transforming these into E. coli and culturing them in media containing two types of antibiotics, colonies were observed. When we performed colony PCR on these colonies using two different types of primers, bands were confirmed at the target positions.
Furthermore, when we collected the membrane fraction from E. coli that was picked up from these colonies and cultured in liquid media, and performed SDS-PAGE and Western blotting, we were able to confirm the presence of the target proteins.
Learn
These experiments confirmed the transformation and localization of functional proteins to the outer membrane. This demonstrated that the plasmids we constructed are compatible with the E. coli strain used in this experiment, that the Spy-tag system and scaffold proteins are functioning normally, and that the target proteins are being synthesized by the constructed plasmids.
Future work includes evaluating the performance of the proteins, and creating MVs with functional proteins on the outer membrane by inducing MV production in E. coli while transforming these plasmids.
References
[1]GreenLight Bioscience “Our Pipleline: RNA Technology in Agriculture ”
[2]Priscila Dauros-Singorenko, Cherie Blenkiron, Anthony Phillips, Simon Swift, The functional RNA cargo of bacterial membrane vesicles, FEMS Microbiology Letters 365 , 2386 (2018).
[3]Koh, S., Sato, M., Yamashina, K. et al. Controllable secretion of multilayer vesicles driven by microbial polymer accumulation. Sci Rep 12 , 3393 (2022).
[4]Koh, S.; Noda, S.; Taguchi, S. Population Dynamics in the Biogenesis of Single-/Multi-Layered Membrane Vesicles Revealed by Encapsulated GFP-Monitoring Analysis. Appl. Microbiol. 2023 , 1027-1036(2023).
[5]Sahu, P.K.; Sao, R.; Choudhary, D.K.; Thada, A.; Kumar, V.; Mondal, S.; Das, B.K.; Jankuloski, L.; Sharma, D. Advancement in the Breeding, Biotechnological and Genomic Tools towards Development of Durable Genetic Resistance against the Rice Blast Disease. Plants, 11, 2386 (2022).
[6]Li X, Jin X, Lu X, Chu F, Shen J, Ma Y, Liu M, Zhu J. Construction and characterization of a thermostable whole-cell chitinolytic enzyme using yeast surface display. World J Microbiol Biotechnol. 30,2577-85(2014).
[7]Niu C, Li X, Xu X, Bao M, Li Y, Liu C, Zheng F, Wang J, Li Q. [Research progresses in microbial 1,3-1,4-β-glucanase: protein engineering and industrial applications]. Chinese Journal of Biotechnology. 35. 1234-1246(2019).
[8]Dong Soo Hwang, Youngsoo Gim, Dong Gyun Kang, Yeon Kyu Kim, Hyung Joon Cha, Recombinant mussel adhesive protein Mgfp-5 as cell adhesion biomaterial, Journal of Biotechnology, Volume 127,727-735 (2007)
[9]Fierle, J.K., Abram-Saliba, J., Brioschi, M. et al. Integrating SpyCatcher/SpyTag covalent fusion technology into phage display workflows for rapid antibody discovery. Sci Rep 9 , 12815 (2019).